Figure 8.
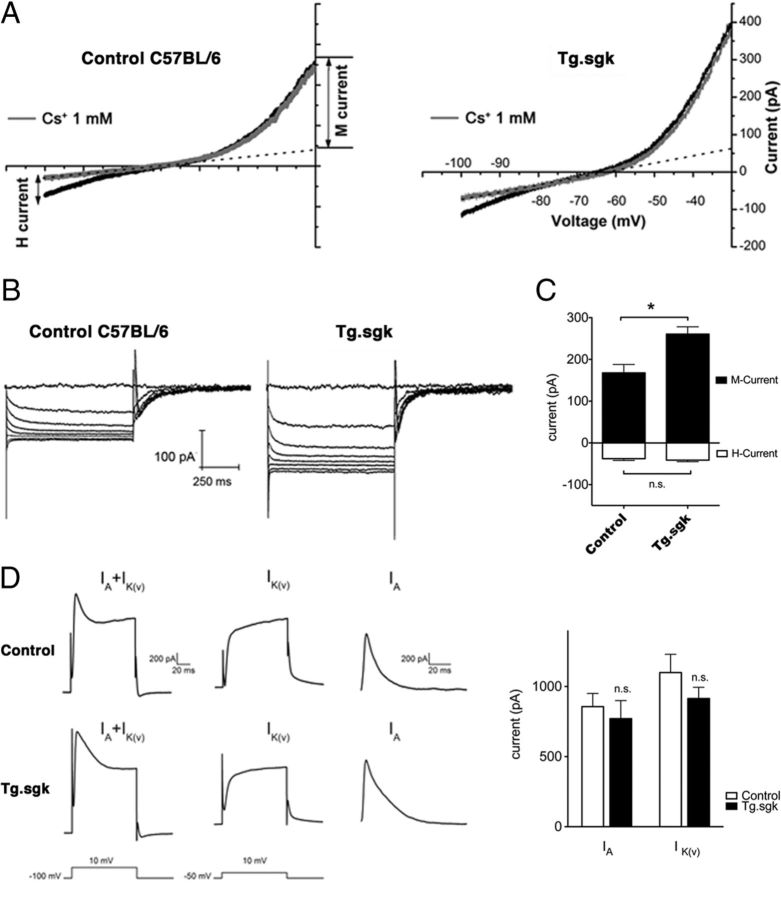
SCG neurons isolated from Tg.sgk mice show a significant increase in M-current. A, Representative voltage-ramp current responses elicited from SCG neurons isolated from control C57BL/6 mice (left) and Tg.sgk mice (right) before (black line) and after (gray line) adding 1 mm Cs. M-current amplitude at −30 mV was measured by subtracting the leak from the total current. The amplitude of the leak current was determined from extrapolated current–voltage curves (dotted line). B, M-currents in response to 2 s voltage steps (−30 to −100 mV in 10 mV increments) in control mice neurons (left) and in Tg.sgk neurons (right). C, Average M-current (positive, black bars) and H-current (negative, white bars) in neurons isolated from control mice (n = 17) and from Tg mice (n = 21). Error bars represent the SEM. *p < 0.05; ns, not significant. D, Left, Representative current traces elicited from control (top) and Tg.sgk (bottom) SCG neurons in response to the voltage pulses indicated below the traces. Right, Average IA and IK(V) current values corresponding to SCG neurons isolated from control (white bars) and Tg.sgk (black bars) mice.

