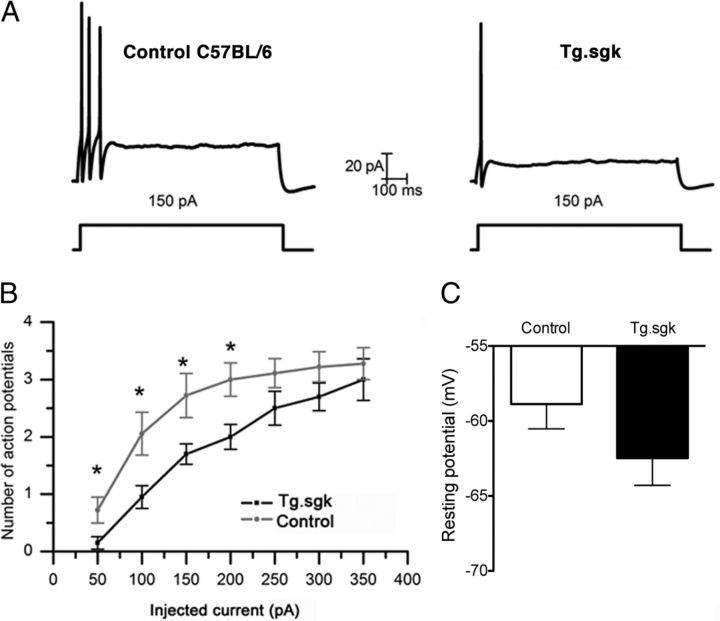
Figure 9.
SCG neurons from Tg.sgk mice show more negative resting potentials and less excitability. A, Representative action potential recordings in response to a 150 pA pulse in SCG neurons isolated from control mice C57BL/6 (left) and Tg.sgk transgenic mice (right). B, Representation of the average number of action potentials generated in response to stimulus of different amplitude (picoamperes) for control mice (gray line) or Tg.sgk–SCG neurons (black line). C, Average resting membrane potential measured in SCG neurons isolated from control mice (white bar, n = 20) and Tg mice (black bar, n = 18). *p < 0.05.

