Figure 1.
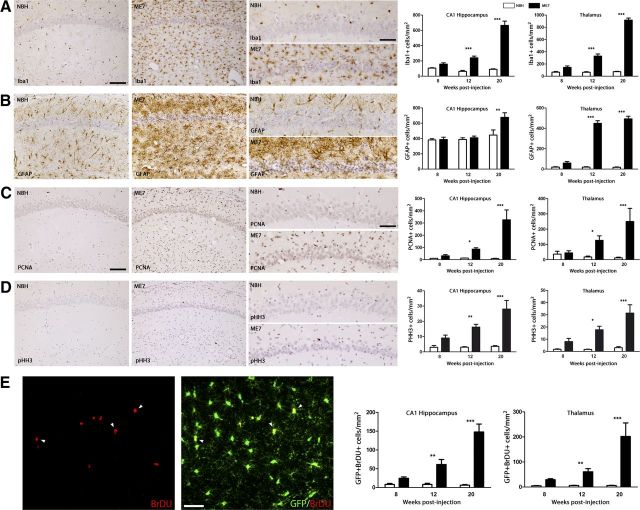
Temporal and regional distribution of microglial proliferation during prion disease. A, B, Immunohistochemical analysis of the expression of Iba1 (microglia, A) and GFAP (astrocytes, B) in the CA1 region of the hippocampus (see representative images) and the thalamus of prion-diseased (ME7) and control (NBH) mice. Quantified data expressed as mean ± SEM of the number of Iba1+ (A) or GFAP+ (B) cells per square millimeter. C, D, Immunohistochemical analysis of the expression of PCNA (A) and pHH3 (B) in the CA1 region of the hippocampus (see representative images) and the thalamus of prion disease (ME7) and control (NBH) mice. Quantified data expressed as the mean ± SEM of the number of PCNA+ (A) or pHH3+ (B) cells per square millimeter. E, Analysis of proliferative microglia (white arrowheads) by double immunofluorescence for BrDU (red) and GFP (microglia, green) in the hippocampus (CA1; representative image) and thalamus of prion (ME7) or control (NBH) mice. Quantified data expressed as mean ± SEM of the number of BrDU+GFP+ cells per square millimeter. *p < 0.05, **p < 0.01, ***p < 0.001. Data were analyzed with a two-way ANOVA and a post hoc Tukey test (n = 6). A–D, Nuclei are stained with H/E (blue). E, Fluorescent sections evaluated with confocal microscopy. Scale bars: A–D (in A, C), 100 μm; A–D, insets (in A, C) 50 μm; E, 20 μm.

