
Figure 4.
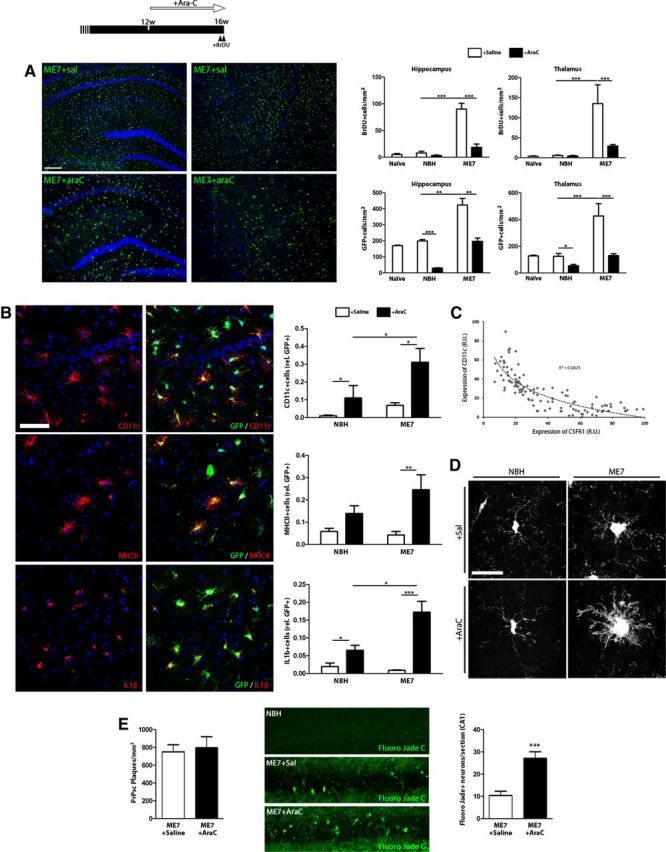
Blockade of mitosis alters the inflammatory phenotype of microglial cells during chronic neurodegeneration. A–E, Effect of the administration of an inhibitor of mitosis (AraC) on the progression of microglial proliferation and neuropathology during prion disease (top). A, Analysis of microglial proliferation by immunohistochemistry for BrDU and GFP (microglia, green, representative images) in the hippocampus and thalamus of prion (ME7, representative images) or control (NBH) mice, treated with AraC or vehicle (saline, Sal), compared with naive mice. Quantified data expressed as mean ± SEM of the number of BrDU+ or GFP+ cells per square millimeter. B, Effect of AraC on the expression of inflammatory markers in microglial cells, analyzed by double immunofluorescence for CD11c, MHCII, or IL1b (red), and GFP (green, microglia), on the hippocampus of prion (ME7) or control (NBH) mice. Quantified data expressed as mean ± SEM of the ratio of CD11c+, MHCII+ or IL1b+ versus the total number of GFP+ microglial cells. C, Correlation of the expression of CD11c and GFP (CSF1R) in single microglial cells in the hippocampus of prion disease mice, measured as relative intensity. D, Effect of AraC or saline (vehicle) on the morphology of GFP+ microglial cells of the hippocampus of prion (ME7) or control (NBH) mice. E, Effect of AraC or saline (vehicle) on the deposition of PrPSc (PrPSc+ plaques, left) and the degeneration of neurons (Fluoro Jade C-positive neurons, green, representative images, right) in the CA1 layer of the hippocampus of prion mice (ME7). Quantified data expressed as mean ± SEM of number of PrPSc+ plaques per square millimeter or Fluoro Jade C+ neurons in CA1. *p < 0.05, **p < 0.01, ***p < 0.001. Data were analyzed with a two-way ANOVA and a post hoc Tukey test (n = 4). A, B, Nuclei are stained with Hoechst (blue). A–C, Fluorescent sections evaluated with confocal microscopy. D, 2D projections of 3D stacks under confocal microscopy. Scale bars: A, 200 μm; B, E, 20 μm; D, 10 μm.