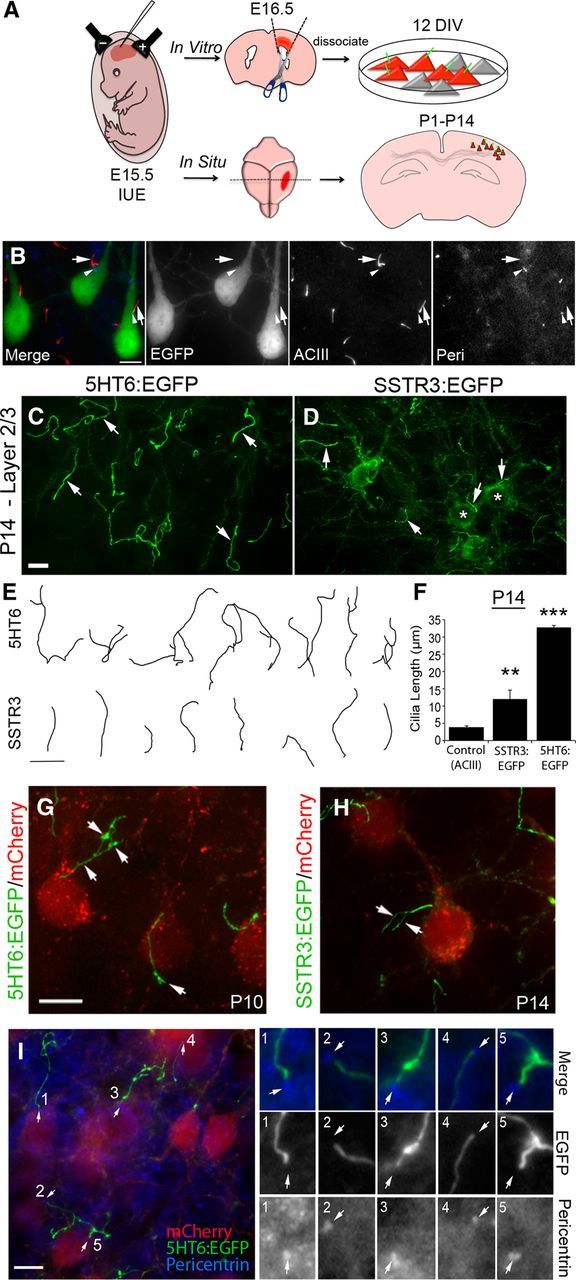
Figure 1.

Overexpression of 5HT6 and SSTR3 in mouse neocortical neurons induces abnormal growth of their primary cilia. A, Flow diagram of electroporation and experimental procedures used to induce and analyze the effects of overexpression of ciliary GPCRs on ciliogenesis in cultured and in situ neocortical neurons. Neurons analyzed in culture were dissected from electroporated cortex at E16.5, dissociated, and cultured up to 12 DIV. Neurons in situ were analyzed in sections of brains between P1 and P40 electroporated mice. B, Examples of layer 2/3 neurons electroporated at E15.5 with a vector encoding EGFP and labeled at P14. EGFP+ pyramidal neurons show normal positioning and morphology of ACIII+ cilia (red, arrows) with pericentrin+ basal bodies (blue, arrowheads) near the base of the apical dendrite, and are comparable to neighboring nonelectroporated neurons. EGFP does not colocalize with ACIII in the EGFP+ neurons. C, D, E15.5 cortices were electroporated with vectors encoding either 5HT6:EGFP (C) or SSTR3:EGFP (D) under control of the EF1α promoter and were analyzed in situ at P14. C, Example of layer 2/3 neurons overexpressing 5HT6:EGFP, which is enriched in cilia (arrows). D, Example of layer 2/3 neurons overexpressing SSTR3:EGFP, which is detected in cilia (arrows) and throughout the cell bodies (*). E, Tracings of EGFP+ cilia elongated by neurons expressing either 5HT6:EGFP and SSTR3:EGFP. Scale bar, 10 μm. F, Comparison of cilia lengths from control (ACIII+), SSTR3:EGFP+, and 5HT6:EGFP+ neurons in layers 2/3 of P14 neocortex. **p < 0.01 (ANOVA). ***p < 0.001 (ANOVA). G, H, Higher-magnification confocal z-stacks of branching cilia with varicosities (arrows) synthesized by mCherry+ pyramidal neurons expressing either 5HT6:EGFP (E) or SSTR3:EGFP (F). Scale bar, 10 μm. I, Sections of P14 neocortex containing mCherry+ neurons (red) with abnormally long and malformed 5HT6:EGFP+ cilia (green) were immunostained for pericentrin (blue). Five EGFP+ cilia with basal bodies were numbered, and their magnified images are displayed as separate channels (3 images) grouped vertically by cilium on the right. Pericentrin+ basal bodies are present at the base of each EGFP+ cilium (I, arrows). Scale bar, 10 μm.
