Figure 8.
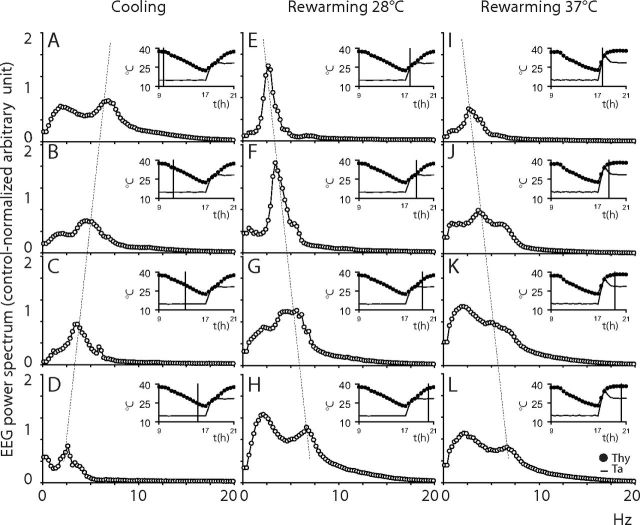
Shift of the EEG power spectrum. In animals exposed to an ambient temperature (Ta) of 15°C, the EEG spectrum showed, during the cooling induced by muscimol injections (data from the M28 group (n = 7), A–D), a progressive reduction of the main spectral components and a progressive shift toward slow frequencies. The rewarming at Ta 28°C (M28 group (n = 7), E–H) induced an immediate large increase in the power of the main spectral component and a progressive shift of the spectrum toward fast frequencies. The rewarming at Ta 37°C for 1 h returning to 28°C afterward (M37 group (n = 6), I–L) induced a progressive shift of the spectrum toward fast frequencies. EEG power spectrum is expressed as the 1 h average spectrum (0.25 Hz resolution) calculated at the time shown by the vertical line in inserts. Inserts show the average time course of deep brain temperature (Tbrain, filled circles) and Ta (continuous line) for a 12 h period (9:00–21:00) during the Injection Day. Vertical dotted lines highlight the temperature-dependent shift in the peak of the EEG Theta band during cooling at Ta 15°C and rewarming at Ta 28°C and Ta 37°C.

