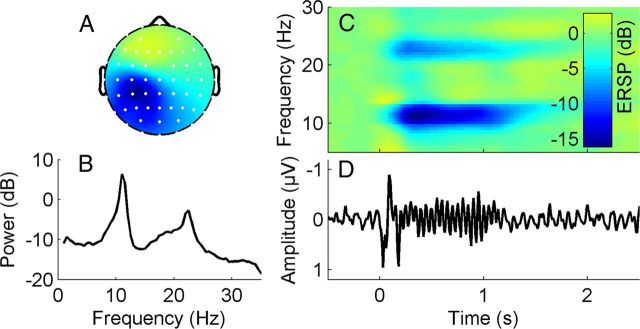
Figure 2.
Properties of an independent component reflecting μ-rhythm activity (μIC) in a representative subject. A, Topographic distribution μIC weights (white dots display channel locations, color-coding as in C, but without units). B, Mean log power spectrum. C, Time-frequency image showing ERSP, which is the relative change in event-related power at different frequencies, time-locked to the high-frequency (20 Hz) repetitive somatosensory coactivation stimulus which starts at time point zero and is sustained for one second. Note the pronounced ERD in the alpha and beta frequency band during stimulation. D, Corresponding averaged somatosensory evoked potential.

