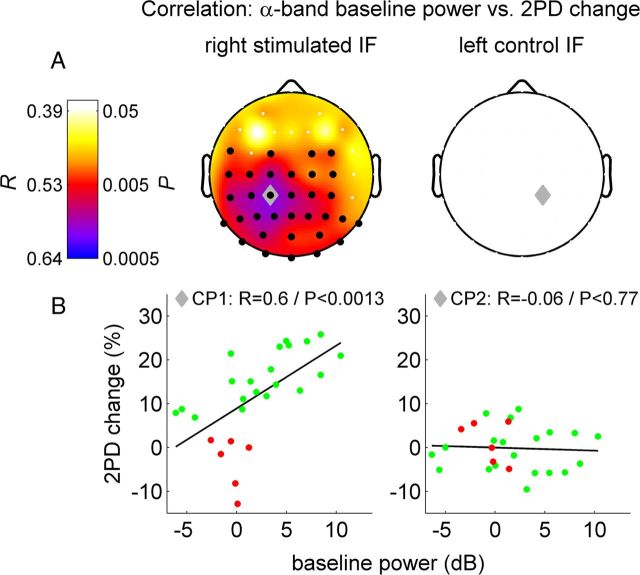
Figure 3.
Correlation between 2PD change (left column: stimulated right IF; right column: control left IF), and alpha band resting-state EEG power before perceptual learning. A, Top row, Scalp distribution of Pearson's correlation coefficients R and corresponding P-values. Black dots, channels within significant cluster (pclust < 0.002). Gray diamond, Channel CP1 with maximum correlation to learning rate (for right IF)/corresponding contralateral channel CP2 (for left IF). B, Scatter plot of single subject values at channels CP1/CP2. Successful learners in green (n = 20), other subjects in red for illustration purposes—no categorization/collapsing was done for correlation analysis.

