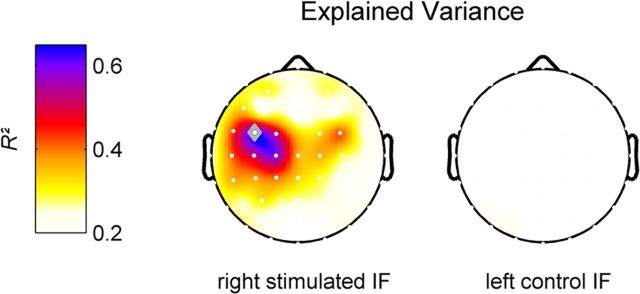
Figure 5.
Topographic scalp map showing the total variance of individual gain in tactile acuity (i.e., 2PD threshold change) after RSS explained by the (channelwise) orthogonalized set of EEG predictor variables, alpha band resting-state power and alpha band ERD (left column, right stimulated IF; right column, left control IF). The explained variances (i.e., the respective R2) of both predictor variables were added to yield the total explained variance. The channel with the maximum explained variance is indicated as a gray diamond (FC3, R2 = 0.638).

