
Figure 9.
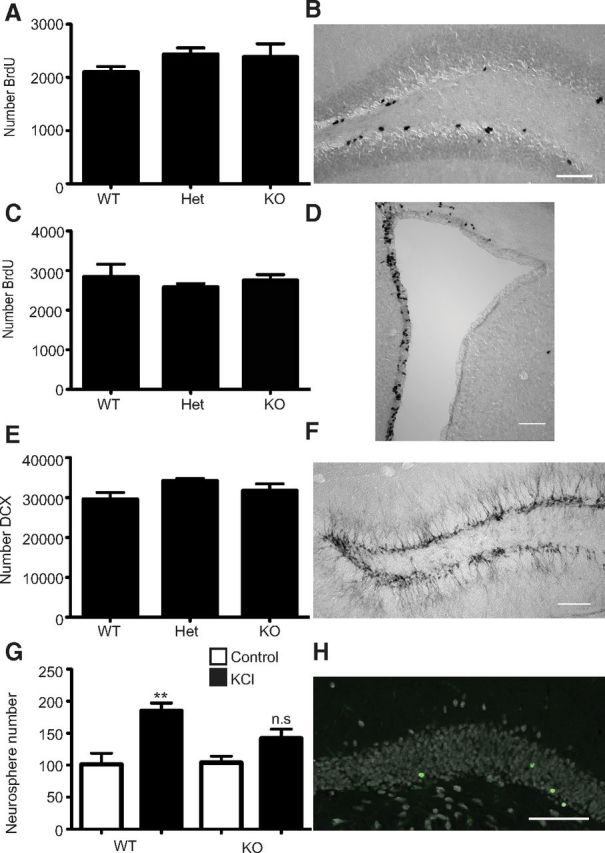
Knock-out of Prominin-1 does not alter precursor proliferation but decreases net hippocampal neurogenesis. A, Histogram depicting the number of BrdU+ cells in the dentate gyrus of wild-type (WT; n = 4), heterozygous (Het; n = 16), and Prominin-1 knock-out (KO; n = 4) mice. B, Representative image of the BrdU-labeled cells in the dentate gyrus. C, Histogram depicting the number of BrdU+ cells in the SVZ of WT (n = 4), Het (n = 16), and Prominin-1 KO (n = 4) mice. D, Representative image of the BrdU-labeled cells in the SVZ. E, Histogram depicting the number of DCX+ intermediate progenitor cells in the dentate gyrus of WT (n = 4), Het (n = 6), and Prominin-1 KO (n = 6) mice. Data represent the mean ± SEM, no significant difference between genotypes one-way ANOVA with Tukey's multiple-comparison test. F, Representative image of the DCX-labeled cells in the dentate gyrus. G, Histogram depicting the number of neurospheres formed from the dentate gyrus of WT (n = 5) and Prominin-1 KO (n = 5) mice. Data represent the mean ± SEM from n = 5 independent experiments F(16) = 8.006; **p ≤ 0.01 one-way ANOVA with Tukey's multiple-comparison test. H, Representative image of BrdU+ (green) and Fox3+ (white) cells in the dentate gyrus. Scale bars: 100 μm.