
Figure 1.
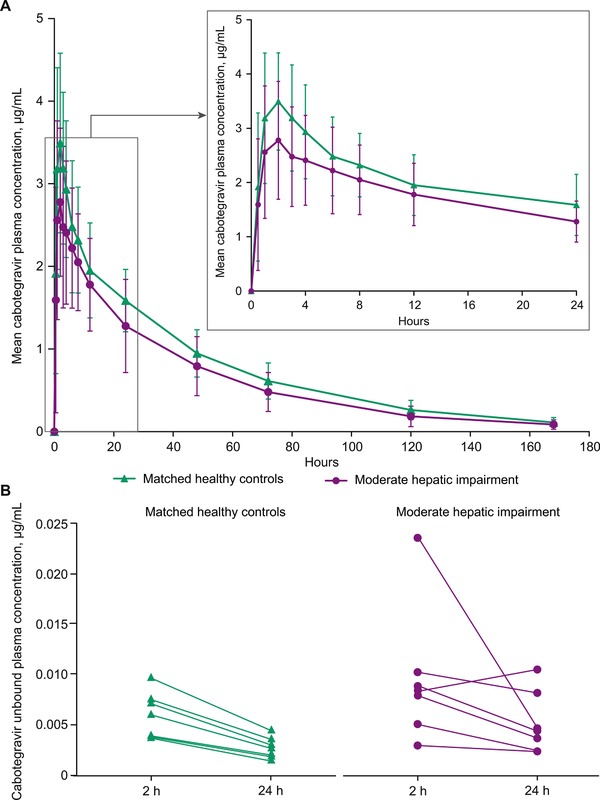
Mean ± standard deviation of (A) total cabotegravir plasma concentrations from 0 to 180 hours after dosing and inset, highlighting 0 to 24 hours, and (B) mean unbound cabotegravir plasma concentrations 2 and 24 hours after dosing.
Official websites use .gov
A
.gov website belongs to an official
government organization in the United States.
Secure .gov websites use HTTPS
A lock (
) or https:// means you've safely
connected to the .gov website. Share sensitive
information only on official, secure websites.
Mean ± standard deviation of (A) total cabotegravir plasma concentrations from 0 to 180 hours after dosing and inset, highlighting 0 to 24 hours, and (B) mean unbound cabotegravir plasma concentrations 2 and 24 hours after dosing.