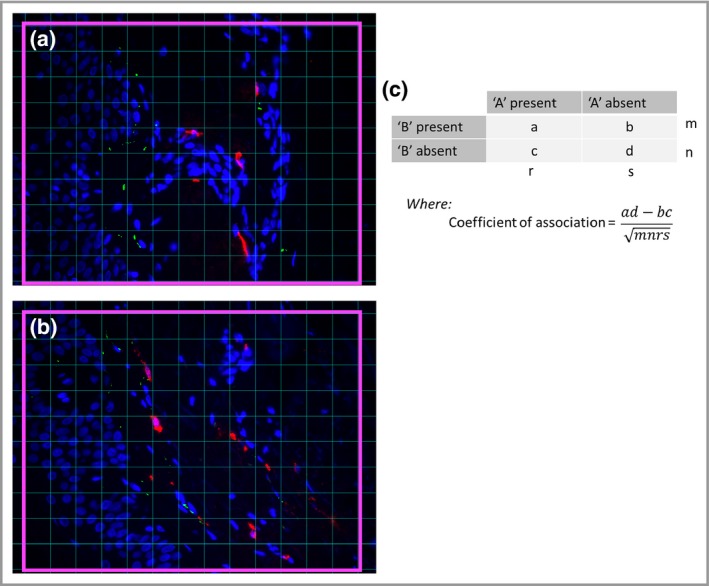
Figure 4.

Calculation of the coefficient of association. (a) Using ImageJ software a grid containing 130 squares (pink boxes) was overlaid onto an image. The numbers of squares containing feature ‘A’, feature ‘B’, both features or neither feature were counted. This was repeated for 10 images and the total numbers of squares for each condition were entered into a 2 × 2 contingency table (b). The values m, n, r and s are the sums of a + b, c + d, a + c and b + d, respectively. The coefficient of association is then calculated from these values, where 0 represents an absence of association and +1 or −1 represents complete association. Positive values represent increased association of the two features with each other, while negative values represent increased association of each feature with itself. Values obtained from young and aged individuals were compared using the unpaired two‐tailed Mann–Whitney U‐test.
