
Figure 7.
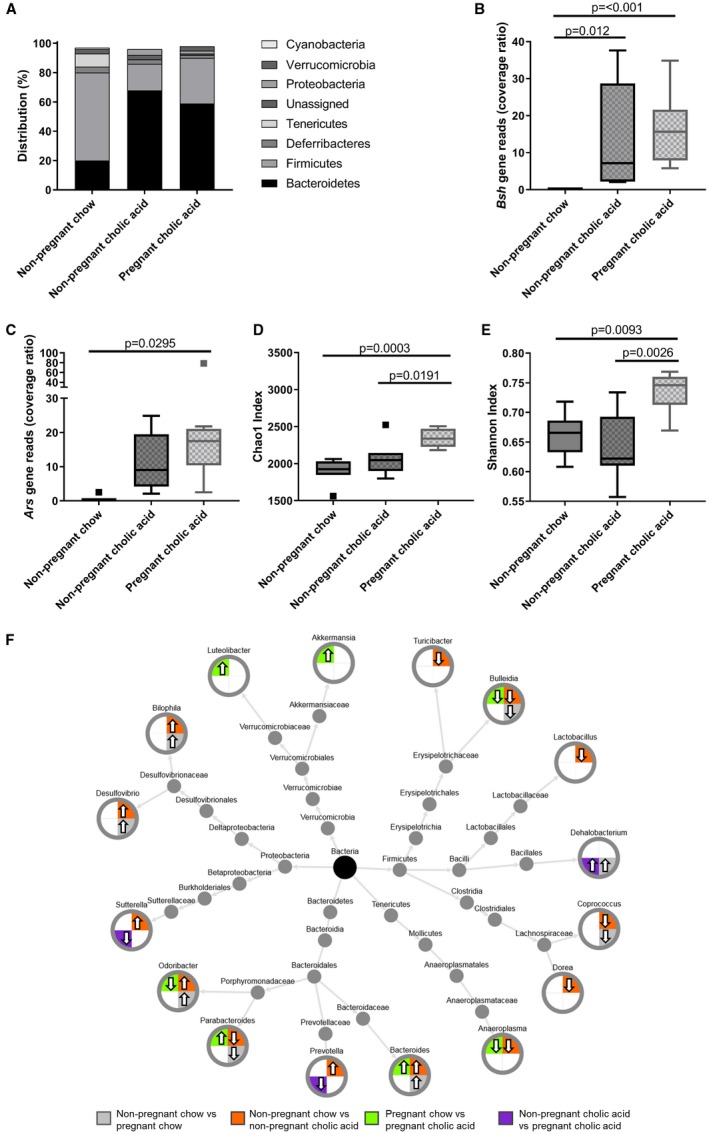
CA dietary supplementation alters the murine cecal microbiota in similar ways to pregnancy. (A) Distribution of cecal microbiota by phylum level for nonpregnant chow‐ and CA‐fed mice, and pregnant CA‐fed mice. N = 6‐8. (B) Bsh and (C) aryl sulfatase (Ars) gene reads in the cecal microbiome of nonpregnant and pregnant mice. Box‐whisker plots demonstrate median (thick line) and interquartile range (IQR), with whiskers at 1.5 IQR. Differences between groups determined by one‐way analysis of variance with Tukey's multiple comparison test. N = 6‐8. (D) Chao 1 richness and (E) Shannon evenness of microbial communities for nonpregnant and pregnant mice. Box‐whisker plots demonstrate median (thick line) and IQR, with whiskers at 1.5 IQR. Differences between groups determined by Kruskal‐Wallis univariate analysis. N = 6‐8 throughout. (F) Taxonomic tree of microbes identified at genus level found to significantly differ after separate comparisons of nonpregnant chow‐ versus pregnant chow‐fed (gray), nonpregnant chow‐ versus nonpregnant CA‐supplemented diet (orange), pregnant chow‐ versus pregnant CA‐supplemented diet (green), and nonpregnant CA‐ versus pregnant CA‐supplemented diets (purple). Arrow direction indicates relative abundancy in the second of the comparator groups. Significance defined as P < 0.05 by White's nonparametric t test with Benjamini‐Hochberg correction.