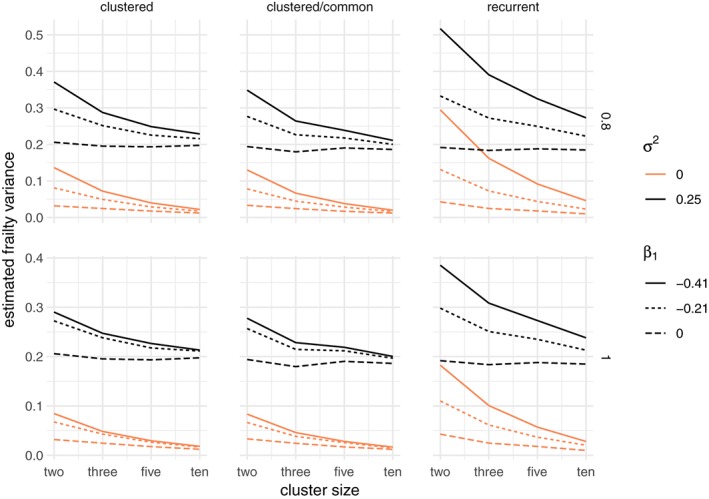
Figure 7.

Estimated frailty variance for a gamma frailty model, when the data are simulated with an unobserved common risk following a lognormal distribution with expectation 1 and variance σ 2 ∈ {0,0.25} and a total sample size of 300. The rows correspond to the Weibull baseline shape parameter, increasing for α = 0.8 and constant for α = 1. The columns correspond to the three main simulation scenarios: clustered failures, clustered failures where the observed covariate only varies between clusters, and recurrent events. β 1 indicates the strength of the time‐dependent covariate effect [Colour figure can be viewed at wileyonlinelibrary.com]
