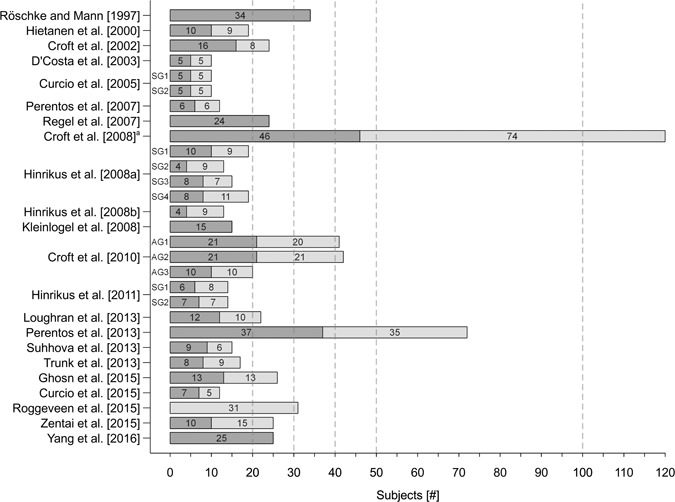
Figure 6.

Size and sex distribution of the samples in the 22 reviewed studies. Dark grey bars display the number of males and light grey bars display the number of females. a)Maximum number of subjects considered for analyses was n = 109. AG = age group; SG = subgroup.
