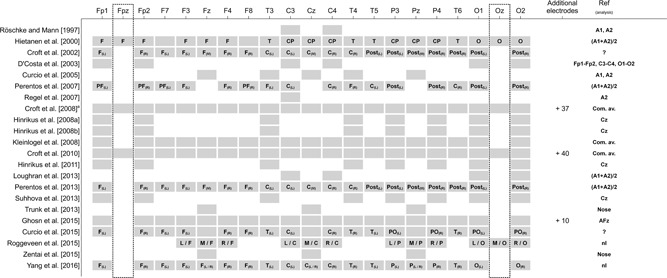
Figure 8.

Number and topographical distribution of EEG electrodes (including EEG analysis references) used in the 22 studies under consideration. Figure shows all 19 EEG electrode positions according to the 10–20‐system [Jasper, 1958] plus electrode positions Fpz and Oz (black dotted‐framed boxes) that do not belong to the standard electrode locations of the 10–20‐system. More than these 21 electrodes were considered in three of the 22 studies. Some studies did not clearly provide information on the reference used for analysis. This lack of information is either indicated by a “?” (not clear whether the specification refers to the recording or to the analysis reference) or by an “nI” (no information is provided about the analysis reference). C = Central; Com. av. = common average; CP = Centroparietal; EEG = electroencephalography; F = Frontal; P = Parietal; PF = Prefrontal; PO = Parieto‐Occipital; Post = Posterior; O = Occipital; L = Left; M = Midline; R = Right; T = Temporal. 1)Not further specified electrodes were grouped into front ipsilateral, front contralateral, posterior ipsilateral, and posterior contralateral scalp regions.
