
Figure 2.
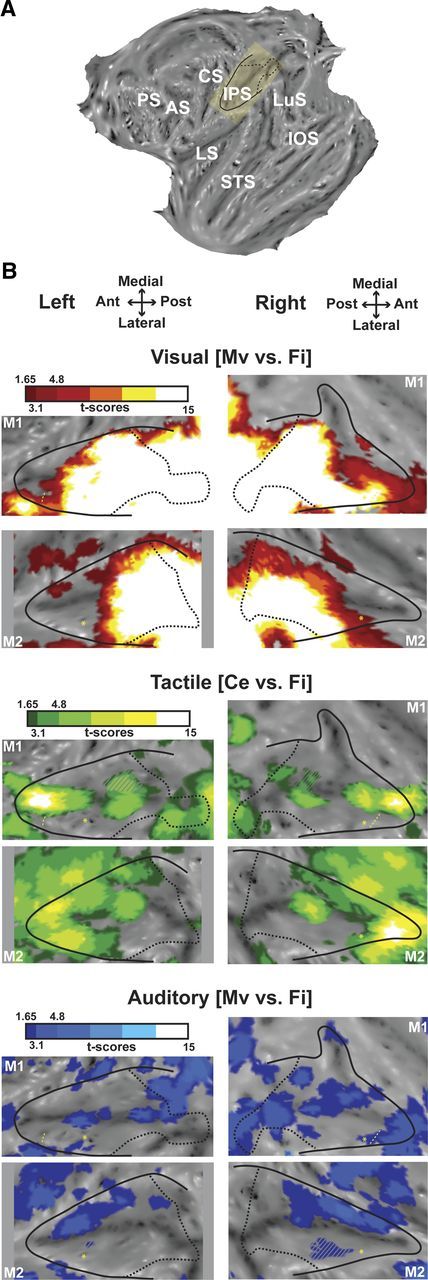
Visual, tactile, and auditory modalities within the intraparietal sulcus. A, Localization of the IPS on the flattened representation of the cortex obtained with Caret (monkey M1, left hemisphere). The yellow inset corresponds to the IPS, which was slightly rotated to be depicted as horizontal in B and in the following figures. Black solid line indicates the limit between the convexity and the banks of the IPS; and black dashed line, projection on the flat map of the most posterior coronal section of the IPS, just before the annectant gyrus can be identified. AS, Arcuate sulcus; CS, central sulcus; IOS, inferior occipital sulcus; IPS, intraparietal sulcus; LS, lateral sulcus; LuS, lunate sulcus; PS, principal sulcus; STS, superior temporal sulcus. B, Activations presented on the flattened IPS for (1) the visual modality (top panels), showing the coherent movement versus fixation contrast (red represents t score scale, color transitions being adjusted to t scores = 1.65 at p < 0.05, uncorrected level; t scores = 3.1 at p < 0.001, uncorrected level and t scores = 4.8 at p < 0.05, FWE-corrected level); (2) the tactile modality (middle panels), showing the center of the face versus fixation contrast (green color t score scale, color transitions as in 1); and (3) the auditory modality (lower panels), showing the coherent movement versus fixation contrast (blue represents t score scale, color transitions as in 1). The hyphenated yellow line corresponds to the anterior boundary of M1 eye movements' regressors extracted from the visual analysis. This limit corresponds to the anterior boundary of the LIP (Durand et al., 2007); nothing reliable was obtained in M2. Yellow asterisk indicates local maximal activation for the central visual field compared with the peripheral visual field, assessed with the retinotopic localizer, and corresponds to the central representation located in anterior LIP (Ben Hamed et al., 2001; Fize et al., 2003; Arcaro et al., 2011). Gray hyphenated areas represent activations spilling over the other bank of the IPS. Top (respectively lower) panels correspond to flat maps of M1 (respectively M2). A, Anterior; L, lateral; M, medial; P, posterior.