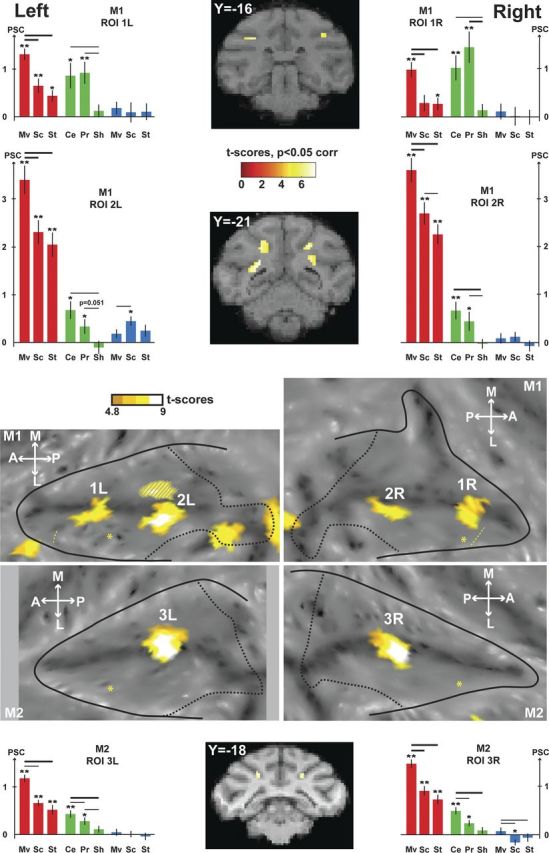
Figure 5.

VT movement-specific conjunction analyses. The contrasts used for the conjunction are the visual contrasts (coherent movement vs scrambled and coherent movement vs static) and the tactile contrast (center of the face vs fixation). The activations are masked by the visual contrast (coherent movement vs fixation) so as to display only positive signal change relative to the fixation baseline. The VT conjunction (p < 0.05, FWE-corrected level) is shown on the flat maps of the two individual monkeys, and SPMs are displayed on two coronal sections in M1 and one coronal section in M2. Histograms show the PSC (mean ± SE) within the ROIs defined by the VT conjunction (1L/1R and 2L/2R for M1, 3L/3R for M2) for each individual condition of the visual runs (red: Mv, Coherent movement; Sc, scrambled; St, static), the tactile runs (green: Ce, Center of the face; Pr, periphery of the face; Sh, shoulders), and the auditory runs (blue). t tests were performed on the PSC for each condition (**p < 0.001, *p < 0.05), and in-between conditions (thick line: p < 0.001; thin line: p < 0.05). For other conventions, see Figure 2.
