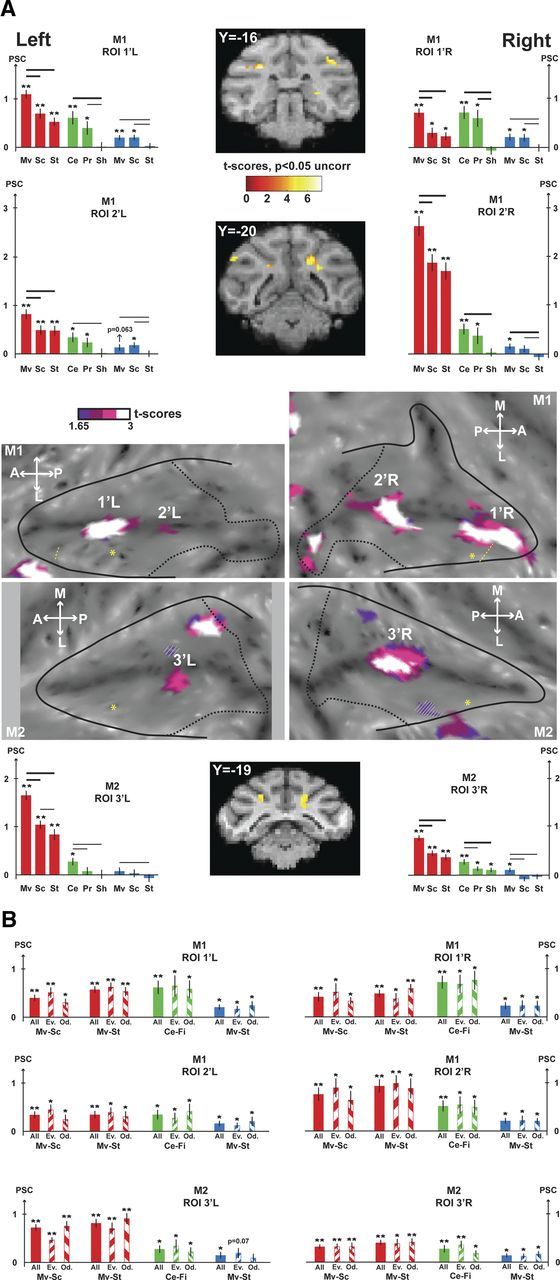
Figure 6.

VAT movement-specific conjunction analyses. A, The contrasts used for the conjunction are the visual contrasts (coherent movement vs scrambled and coherent movement vs static), the tactile contrast (center of the face vs fixation), and the auditory contrast (coherent movement vs static). The VAT conjunction is shown at the uncorrected level (p < 0.05). The activations are masked by the visual contrast (coherent movement vs fixation) so as to display only positive signal change relative to the fixation baseline. For other conventions, see Figure 5. B, Test-retest analyses performed on VAT ROIs (1′L/1′R and 2′L/2′R for M1, 3′L/3′R for M2). For each region of interest, histograms show the PSC (mean ± SE) for the contrasts of interest used to define the VAT conjunction (visual contrasts: Mv-Sc, coherent movement vs scrambled; Mv-St, coherent movement vs static; tactile contrasts: Ce-Fi, center of the face vs fixation; auditory contrast: Mv-St, coherent movement vs static). For each sensory modality and each contrast, PSC of the whole dataset (full colored bars) and even/odd subsets (135°/45° hatched colored bars) are presented. t tests were performed on the PSC for each condition (**p < 0.001; *p < 0.05).
