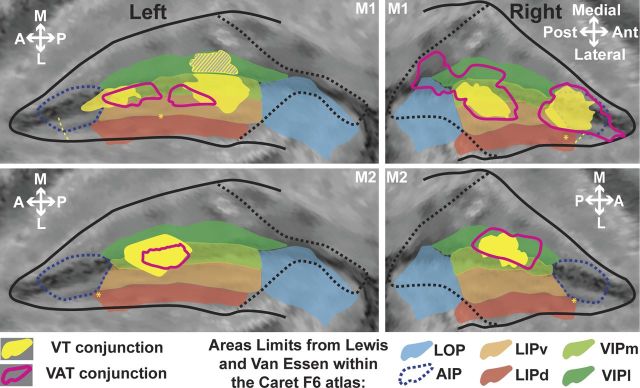
Figure 7.
Projection of the VT and VAT conjunction results onto the F6 Caret atlas. Only the activations at the fundus of the IPS are represented. The boundaries of relevant IPS subdivisions as defined in the F6 atlas from Lewis and Van Essen (2000a, 2000b) are color shaded. See main text for a discussion of the boundaries of the AIP (dotted blue lines). For other conventions, see Figure 2.

