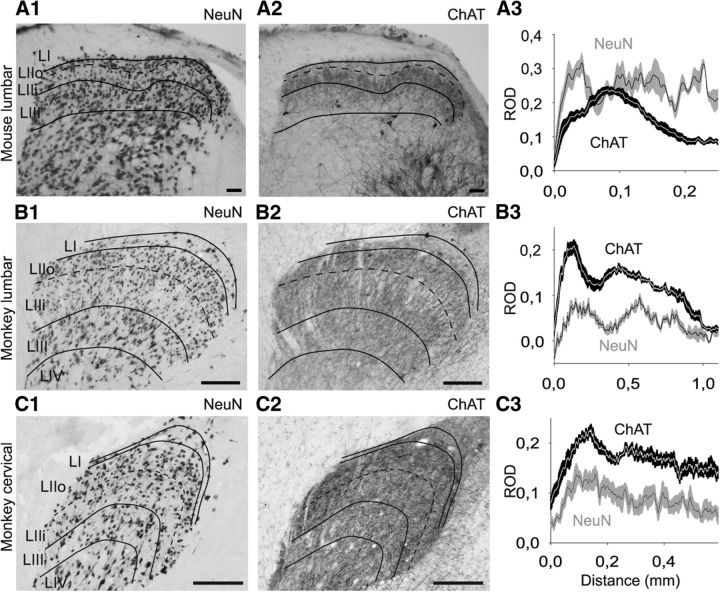
Figure 2.
ChAT and NeuN labeling in mouse (A) and monkey (B, C) spinal cord. A, Comparison between NeuN (A1) and ChAT (A2) labeling in lumbar mouse spinal cord on adjacent transverse sections (50-μm-thick). Graphic representation of the ROD of anti-NeuN (gray) and anti-ChAT (black) immunolabeling in the dorsal horn of mouse (A3). RODs were measured within a rectangle measuring 465 × 1110 μm (for monkey lumbar spinal cord), 240 × 590 μm (for monkey cervical spinal cord), or 147 × 250 μm (for mouse) placed with one of the shorter sides at the dorsal limit of the dorsal gray matter and centered in the mediolateral axis of the dorsal horn. The ROD values (obtained by the software along a line parallel to the shorter axis of the rectangle) were exported for every pixel along the dorsoventral axis. B1–B3, Equivalent to A1–A3 but represent monkey lumbar material. C1–C3, Represent monkey cervical material. For one animal (six sections), the data are mean ± SEM. Scale bars: A, 100 μm; B, C, 250 μm. LI, lamina I; LIIo, lamina II outer part; LIIi, lamina II inner part; LIII, lamina III; LIV, lamina IV.

