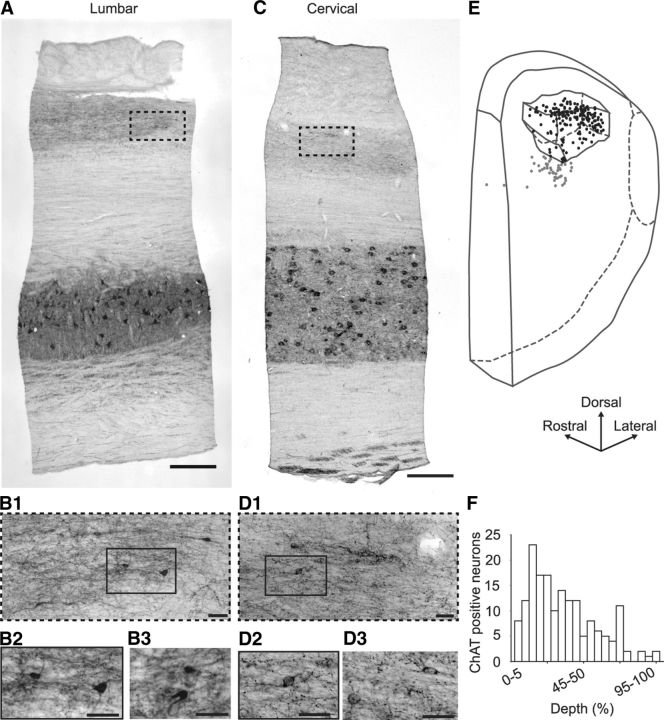
Figure 4.
ChAT labeling on parasagittal sections from monkey lumbar and cervical spinal cord. A, Low-magnification parasagittal view of ChAT labeling in a lumbar spinal cord section (30-μm-thick). B, High-magnification of ChAT-IR neurons in the dorsal horn of similar sections. B1, High-magnification view of the hyphenated region outlined in A. B2, High-magnification view of the rectangle outlined in B1. B3, Another high magnification view. C, Low-magnification parasagittal view of ChAT labeling in a cervical spinal cord section (30-μm-thick). D, High-magnification of ChAT-IR neurons in the dorsal horn of similar sections. D1, High-magnification view of the hyphenated region outlined in C. D2, High-magnification view of the rectangle outlined in D1. D3, Another high magnification view. E, The 3D localization of ChAT-IR cell bodies in the dorsal horn of a 1.76-mm-long lumbar segment of monkey spinal cord; only half of the neurons are represented for improved clarity. The borders of the ChAT-IR plexus are outlined; ChAT-IR neurons located within (respectively, outside) the plexus are represented by black (gray) dots. F, Distribution of ChAT-IR neurons within the ChAT-IR plexus along a dorsoventral axis. The dorsoventral position of each of the 171 ChAT-IR neurons located within the ChAT-IR plexus in every second section (30-μm-thick) of the spinal cord fragment shown in E was noted as follows: 0% if located at the dorsal edge of the plexus and 100% if located at its ventral edge. Scale bars: A, C, 500 μm; B, D, 50 μm.

