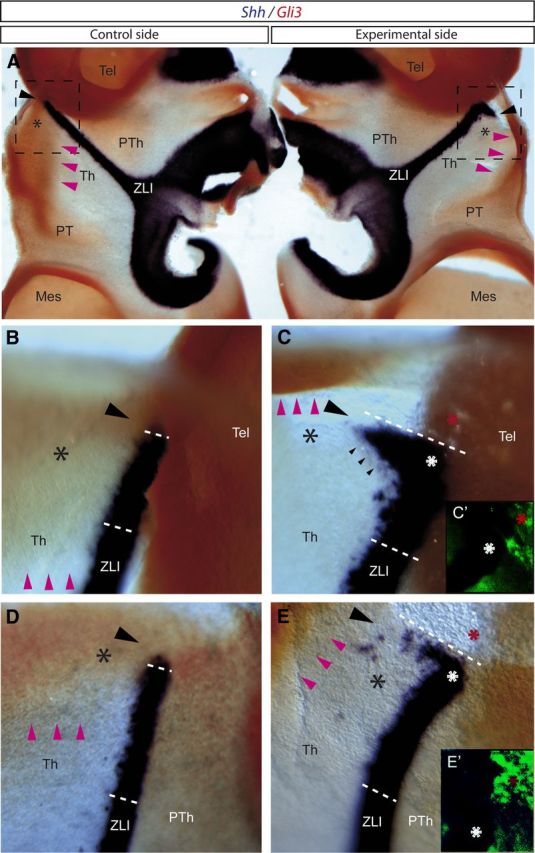
Figure 10.

Transplantation of Wnt1-expressing cells results in repression of Gli3 expression and induction of Shh expression in the dorsal region of the thalamus. A–E, Embryos analyzed by ISH for Shh in blue and Gli3 in red. A, Dorsal view of embryos (opened through the midline) analyzed by ISH for Shh and Gli3. B, C, Magnification of the squares represented in A. B, D, Control side of embryos transplanted with Wnt1-expressing cells. C, E, Experimental side of embryos transplanted with Wnt1-expressing cells. C′, E′, Immunofluorescence for QCPN. Black asterisks mark the most dorsal region of the thalamus, in which Gli3 is normally expressed (see control side in A, B, D). Pink arrowheads label the ventral limit of Gli3 expression in the thalamus. Increasing negative gap of Gli3 expression is observed in the experimental side of the embryos (see pink arrowheads in C and E compared with B and D, respectively). Black arrowheads indicate the region in which ectopic Shh expression is observed near to the place where Wnt1-expressing cells were transplanted (red asterisks in C, C′, E, E′). White asterisks (C, E) indicate the most dorsal domain of the ZLI. Mes, Mesencephalon; Tel, telencephalon; Th, thalamus; PT, pretectum; PTh, prethalamus.
