Figure 1.

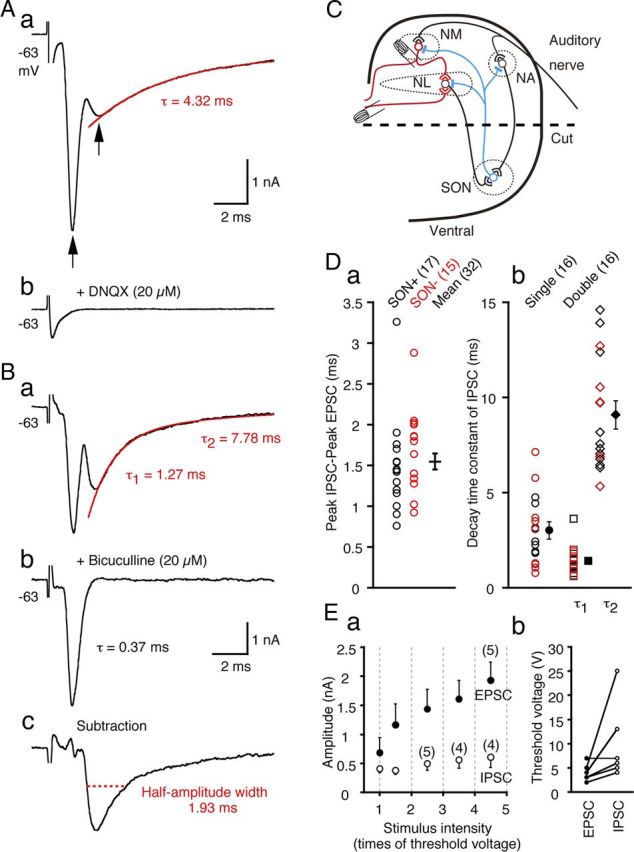
IPSCs are evoked by a local circuit in low-CF NL neurons. A, Representative traces of postsynaptic currents recorded from a low-CF NL neuron before (a) and after (b) bath application of DNQX (20 μm). The arrows indicate the peak current responses. Application of DNQX eliminated both current responses. The red line is a single-exponential fit to the decay phase of the IPSC, and the decay time constant (τ) is indicated. B, Synaptic currents recorded from another low-CF NL neuron before (a) and after (b) bath application of bicuculline (20 μm) and the subtraction of a–b (c). The red line is a double-exponential fit to the decay phase of the IPSC. The decay time constants of the IPSC (τ1 and τ2) (a) and EPSC (τ) (b) are indicated. The red dotted line indicates the half-amplitude width of the isolated IPSC. C, A schematic drawing of the ITD coding circuit in the chicken brainstem. Excitatory terminals and inhibitory terminals are indicated by open and filled symbols, respectively. In some experiments, the ventral half of the coronal slices were dissected out to remove the projections from SON neurons (broken line labeled “cut”). D, IPSC delays relative to EPSC (a) and IPSC decay time constants (b) measured in intact slices (open black symbols) and slices after SON dissection (red symbols). No significant differences were observed between the two groups (p > 0.2), and the mean was calculated from the pooled data (filled symbols with error bars). The decay time courses of IPSCs of one group of neurons were fit with single-exponentials and those of the other group of neurons were fit with double-exponentials, and the time constants are plotted separately. The numbers in the parentheses are the numbers of cells in this and subsequent figures. Ea, The EPSC and IPSC amplitudes are plotted against the stimulus intensity, which was normalized to the threshold stimulus voltage. Amplitude of synaptic current was averaged within the interval indicated by the gray dotted lines and plotted at the center of the intervals. For samples smaller than six, sample numbers are in parentheses. Eb, The threshold stimulus intensities for the EPSCs and IPSCs are connected with solid line for individual neurons.
