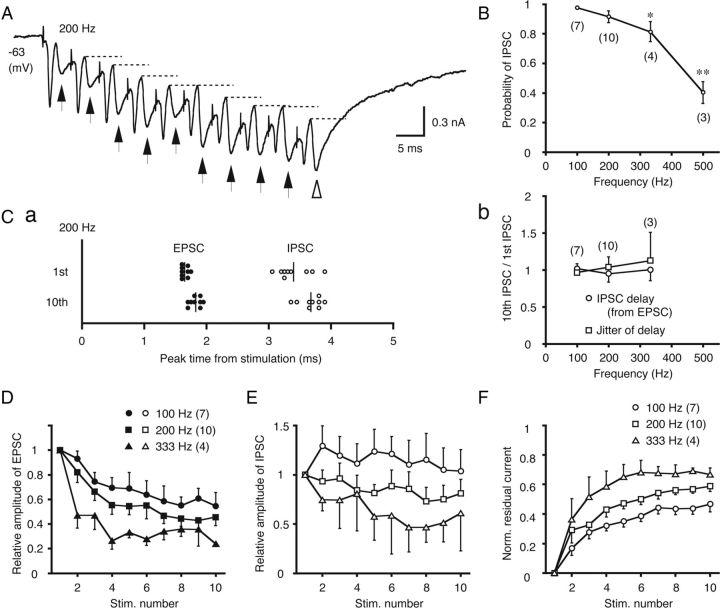
Figure 2.
IPSCs precisely follow EPSCs during repetitive, low-frequency stimulation. A, The postsynaptic currents of low-CF neurons elicited by 10 stimuli at 200 Hz. This trace represents the average of five trials. The arrows indicate the IPSCs and the broken lines indicate the residual component of the inhibitory currents in each cycle. B, The probabilities of detecting IPSCs for each stimulation were measured for each trial and averaged. The statistical significance is indicated by *p < 0.05 or **p < 0.01 in this and subsequent figures. Ca, The peak times of EPSCs and IPSCs relative to each stimulation are plotted for first and tenth stimulations of the train. Samples from a single cell are represented, and this cell is different from that in A. Vertical lines indicate the averages of each peak time. Cb, The IPSC delay relative to the EPSC and the fluctuation of the IPSC delay were compared between the first and tenth stimulations (tenth/first) at different stimulus frequencies (100–333 Hz). D, The EPSC amplitudes normalized to the first EPSC are plotted against the stimulus number in the train. E, The IPSC amplitudes, normalized to the first IPSC. F, The accumulated currents were measured from the baseline to the start of each IPSC (indicated by broken lines in A), and normalized to the maximum amplitude of the total synaptic current (open arrowhead in A).

