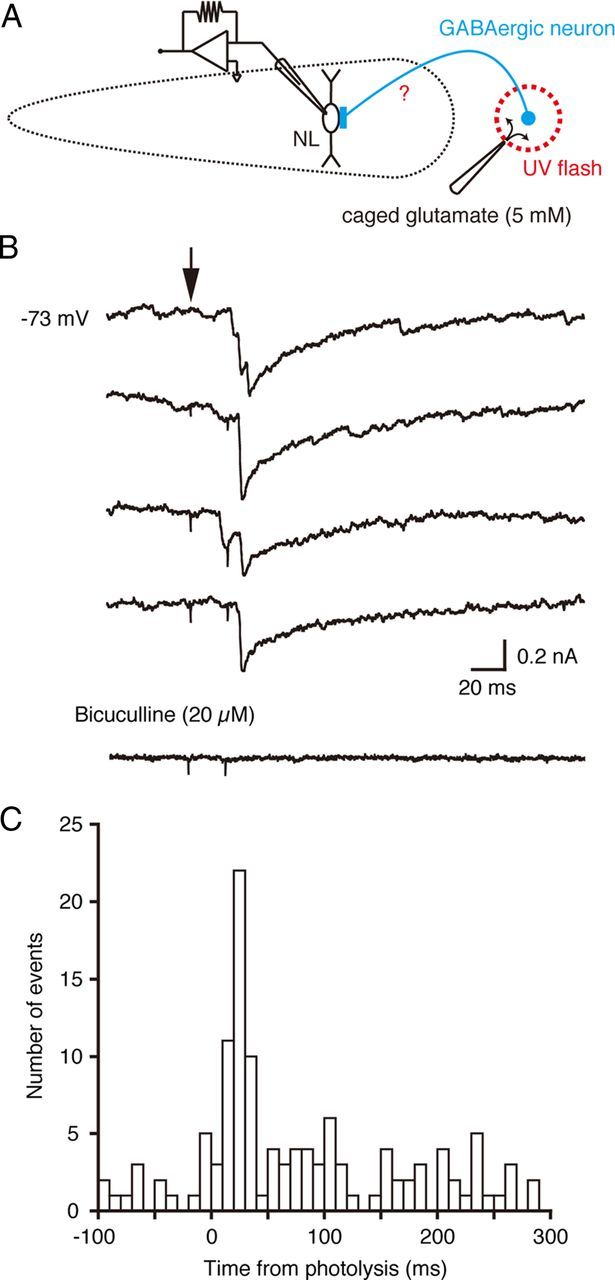
Figure 4.

Photoactivation of local GABAergic neurons. A, A schematic drawing of the experimental procedure. A UV flash was applied to release glutamate by uncaging in the area lateral to the low-CF region of the NL. The current responses were recorded from low-CF NL neurons. B, A series of current responses in a low-CF NL neuron before (4 top traces) and after (bottom trace) application of bicuculline. The time of photoactivation is indicated with an arrow. The recording temperature was 20°C. C, A peristimulus time histogram of the events measured in the recording of B. The spontaneous events are included.
