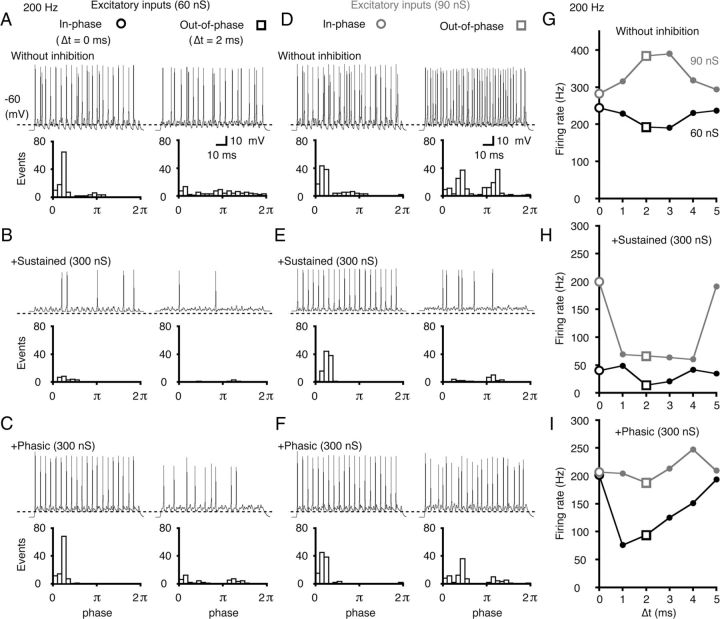
Figure 6.
Model simulation of sustained and phasic inhibition in low-CF neurons. A–F, The simulated firings of a model neuron with low-level (60 nS; A–C) and high-level (90 nS; D–F) excitatory inputs. Bilateral excitatory inputs were applied in-phase (left, Δt = 0 ms) or out-of-phase (right, Δt = 2 ms) ITDs. A, D, No inhibition was applied. B, C, E, F, Inhibition was applied at 300 nS. Sustained inhibition (B, E) or phasic inhibition (C, F) was separately applied. Representative traces (top) and period histograms of spike activity (bottom) are shown in each condition. The broken lines in each trace indicate a voltage level of −60 mV. The period histograms combine the data from five trials of a stimulus train (200 Hz; 5 ms corresponded to one cycle, 2π). G–I, The firing rates were plotted as a function of Δt (ITD-tuning curve) for both the low-level (60 nS, black lines) and high-level (90 nS, gray lines) excitatory inputs without inhibition (G), with sustained inhibition (H), and with phasic inhibition (I). The two open symbols (○, □) correspond to Δt shown in A–F.

