Figure 7.
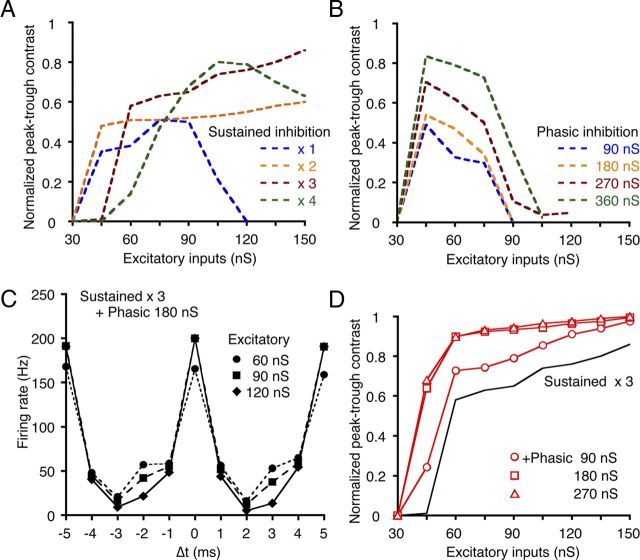
The effects of sustained and phasic inhibition depend on the level of excitatory input and are complementary. A, B, A series of peak–trough contrasts in the ITD-tuning curves was calculated as a function of the excitatory conductance level with either sustained (A) or phasic (B) inhibition. The conductance levels of the sustained inhibition increased in proportion to the total conductance of the excitatory inputs (×1–4, indicated with different colors). The conductance levels of phasic inhibition were set at four constant levels. C, ITD-tuning curves were simulated by including both the sustained (×3 of excitatory input) and the phasic (180 nS) inhibitions. Different symbols indicate the conductance level of the excitatory inputs. D, The peak–trough contrasts were calculated by including both the sustained and phasic inhibition. The black line indicates the peak–trough contrast with sustained inhibition adopted from A (×3 of excitatory input). The phasic inhibitions of the different conductance levels improved the peak–trough contrast (red lines).

