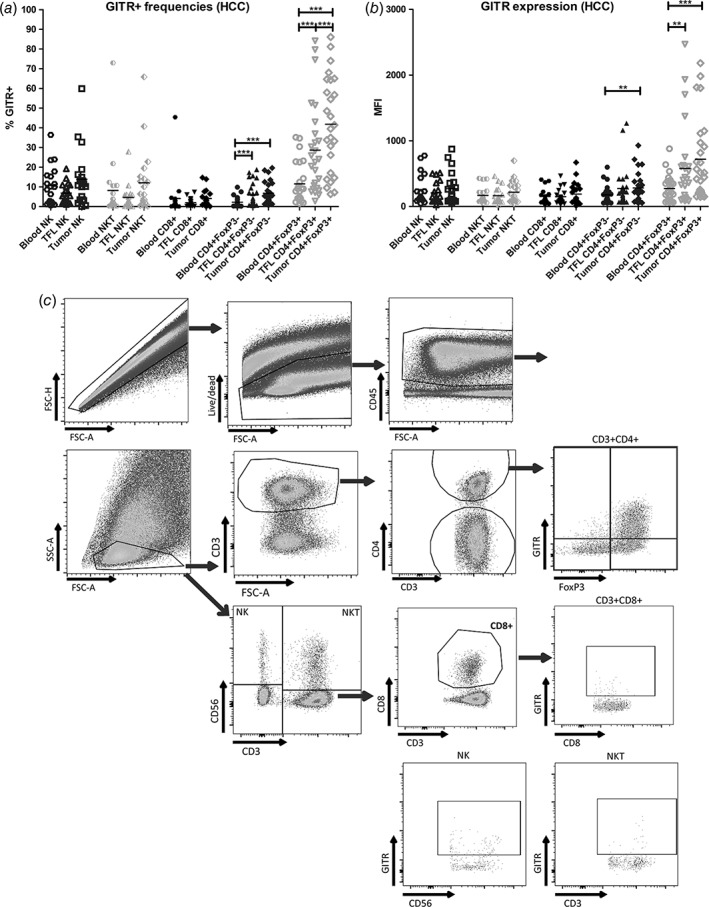
Figure 1.

CD4+FoxP3+ TIL from HCC patients show highest GITR expression. (a) GITR+ cell frequencies within NK cells, NKT cells, CD8+, CD4+FoxP3− and CD4+FoxP3+ T cell subsets in mononuclear leukocytes isolated from blood, tumor‐free liver (TFL), and tumor tissues from HCC patients. (b) As in (a), showing median fluorescence intensities (MFI) of GITR expression on the indicated immune cell subsets. Dots represent individual patients and lines present means. N = 19–26 patients. ** = p < 0.01; *** = p < 0.001. (c) Representative FACS dot plots of one patient display the gating strategies.
