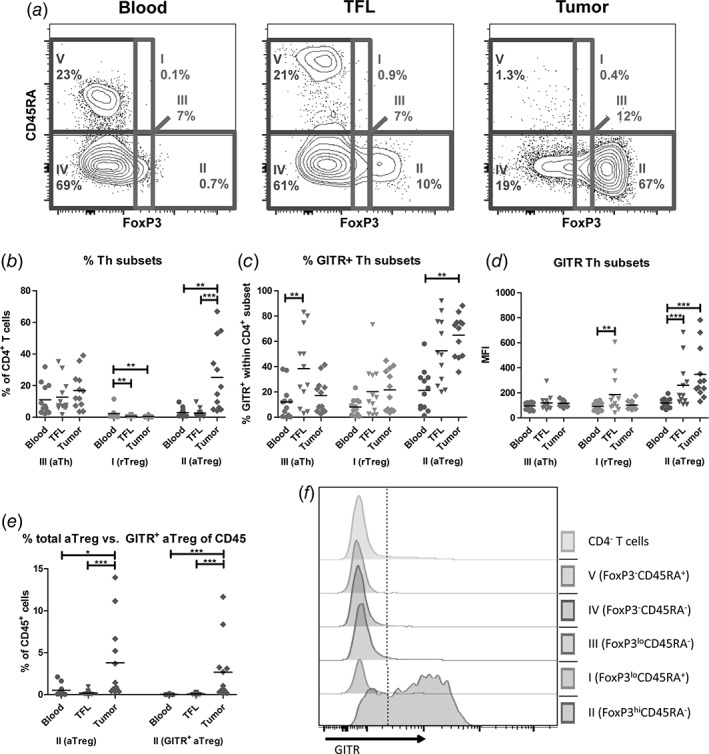
Figure 2.

Activated Treg are highly enriched in HCC tumors and express the highest levels of GITR. (a) Representative example of flow cytometric analysis of CD4+ T cell subsets by FoxP3 and CD45RA, identifying five fractions: FoxP3loCD45RA+ resting Treg (fraction I), FoxP3hiCD45RA− activated Treg (fraction II), FoxP3loCD45RA− activated Th (fraction III), FoxP3−CD45RA− memory Th (fraction IV), and FoxP3−CD45RA+ naïve Th (fraction V). (b) Percentages of fractions I‐III within CD4+ T cells. (c) GITR+ frequencies within fractions I‐III. (d) Median fluorescence intensities (MFI) of GITR expression on cells within fractions I‐III. (e) Percentages of total activated Treg (left) and GITR+ activated Treg (right) within CD45+ mononuclear leukocytes. Dots represent individual patients and lines present means. N = 12 patients. * = p < 0.025; ** = p < 0.01; *** = p < 0.001. (f) Representative FACS histograms of one patient display the expression of GITR in CD4+ T cell subsets.
