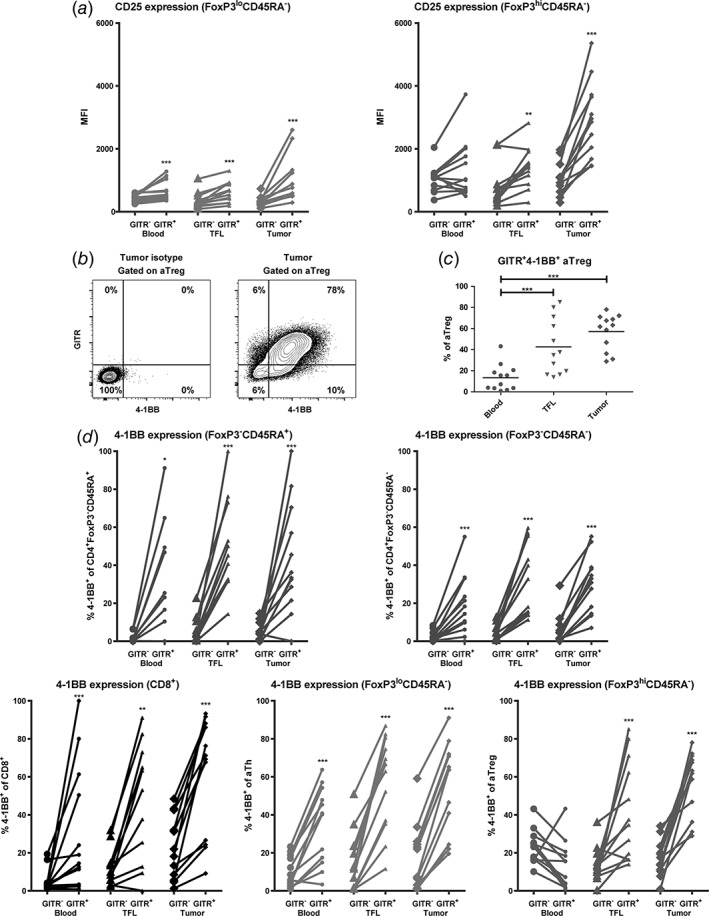
Figure 3.

GITR expression on activated T cell subsets is accompanied by increased CD25 and 4‐1BB expression. (a) GITR+ activated T helper (CD4+FoxP3loCD45RA−) and activated regulatory T cell (CD4+FoxP3hiCD45RA−) subsets express higher levels of CD25 than their GITR− counterparts. (b) Representative example of flow cytometric analysis, showing co‐expression of GITR and 4‐1BB on intra‐tumoral activated Treg (aTreg) (fraction II). (c) Percentages of GITR+4‐1BB+ activated Treg in blood, TFL, and tumor. Dots represent individual patients and lines present means. (d) 4‐1BB+ frequencies within GITR− versus GITR+ cells of CD8+ T cells and four different CD4+ T cell subsets in blood, TFL, and tumor. N = 12 patients. * = p < 0.05; ** = p < 0.01; *** = p < 0.001.
