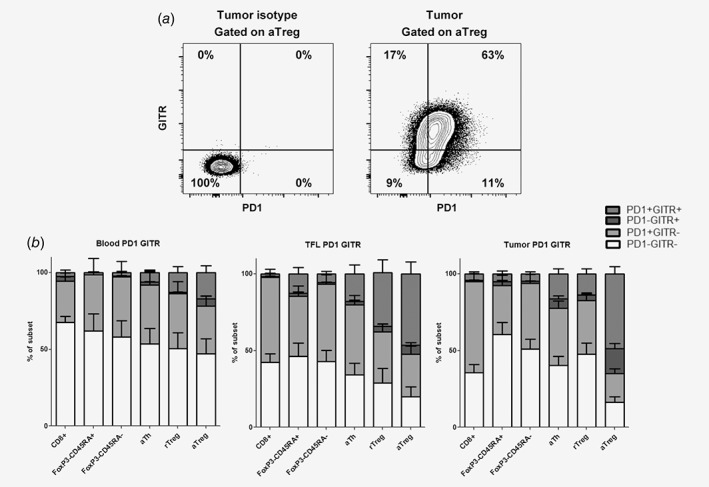
Figure 6.

Co‐expression of GITR and PD1. (a) Representative example of flow cytometric analysis of GITR and PD1 expression on tumor‐derived activated Treg. (b) Mean frequencies of GITR−PD1−, GITR−PD1+, GITR+PD1− and GITR+PD1+ within CD8+ T cells, FoxP3−CD45RA+ Th, FoxP3−CD45RA− Th, activated Th, resting Treg and activated Treg in blood, TFL, and tumor with SEM. N = 12 patients.
