
Figure 2.
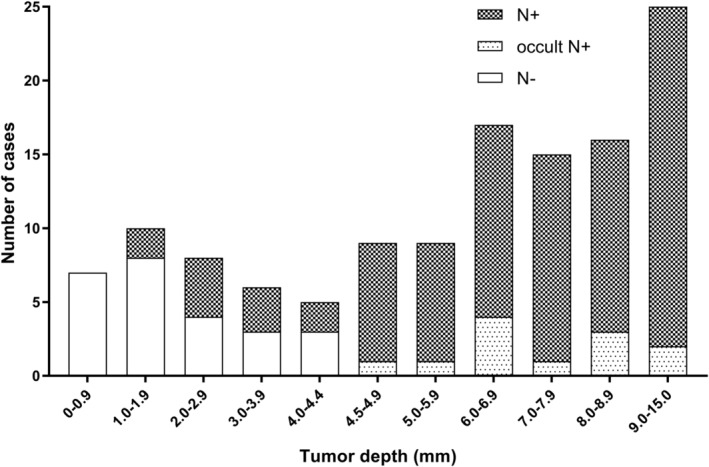
The distribution of pathological nodal status in terms of the range of tumor depth. (a) N+: clinically and pathologically positive nodal status; (b) occult N+: clinically negative nodal status with pathologically positive confirmation; (3) N−: clinically and pathologically negative nodal status