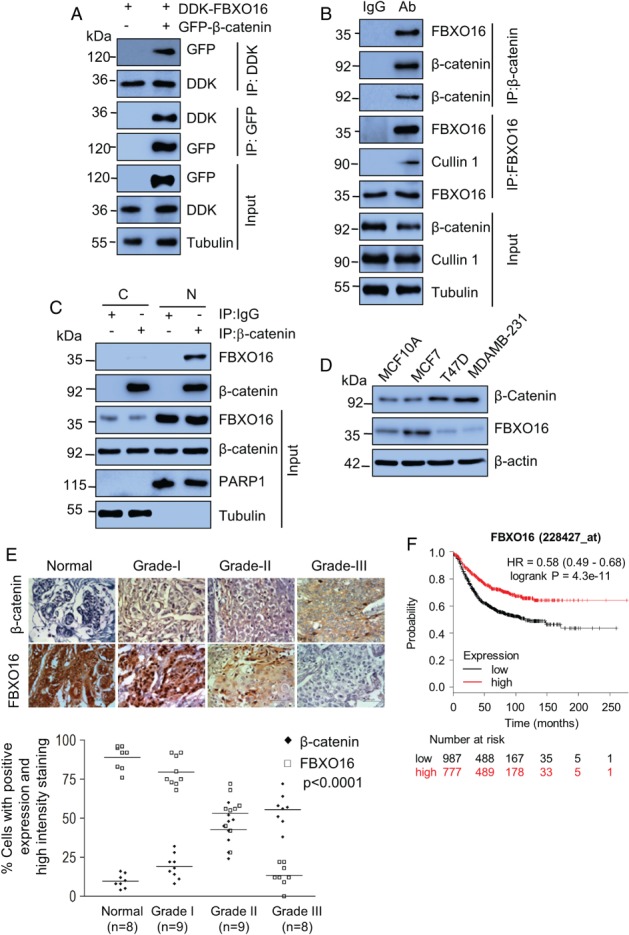
Figure 1.

FBXO16 interacts with β‐catenin. (A) MCF7 cells coexpressing DDK‐FBXO16, either with vector control or GFP‐β‐catenin for 40 h, were then incubated with 5 μm MG132 for 6 h. Whole‐cell lysates were immunoprecipitated with the indicated antibodies. Immunoprecipitates and input lysates were separated on SDS‐PAGE and immunoblotted for the indicated proteins. Tubulin was used as a loading control throughout our study (n = 3). (B) Whole‐cell lysates of MCF7 cells, pretreated with 5 μm MG132 for 6 h before harvesting, were immunoprecipitated with the indicated antibodies to pull‐down endogenous proteins. IgG immunoprecipitates were used as a control. Immunoprecipitates and input lysates were separated on SDS‐PAGE and immunoblotted for the indicated proteins (n = 2). (C) Nuclear and cytoplasmic fractions were immunoprecipitated with either anti‐β‐catenin antibody or IgG. Immunoprecipitates and input lysates were separated on SDS‐PAGE and immunoblotted for the indicated proteins (n = 2). Cells were grown in the presence of 5 μm MG132 for 6 h before harvesting. (D) Whole‐cell protein extracts of MCF10A, MCF7, T47D, and MDA‐MB‐231 cells were immunoblotted for β‐catenin, FBXO16, and tubulin (n = 3). β‐actin was used as a loading control. (E) (Top) Expression levels of β‐catenin (top row) and FBXO16 (bottom) in samples of normal and different grades of breast cancer. Tissues were immunostained as described in the ‘Materials and methods’ section. Lower panel: the statistical analysis of the average score of β‐catenin and FBXO16 staining between cancer tissues and corresponding nontumor tissues, p < 0.0001 (one‐way ANOVA). Staining intensity of these proteins in neoplastic cells was graded on a scale of 0 (no staining) to 3+ (strong staining). The protein expression was scored based on the percentage of positive cells: 0 = 0% of stained positive cells; 1 = weakly stained tissue or 1–25% of positive cells; 2 = moderate stained tissue or 26–50% of positive stained cells; and 3 = strongly stained tissue or more than 50% of stained cells. (F) Kaplan–Meier plot depicting overall survival of breast cancer patient cohorts with different levels of FBXO16 expression. Red trace represents comparative higher expressions of FBXO16.
