Figure 6.

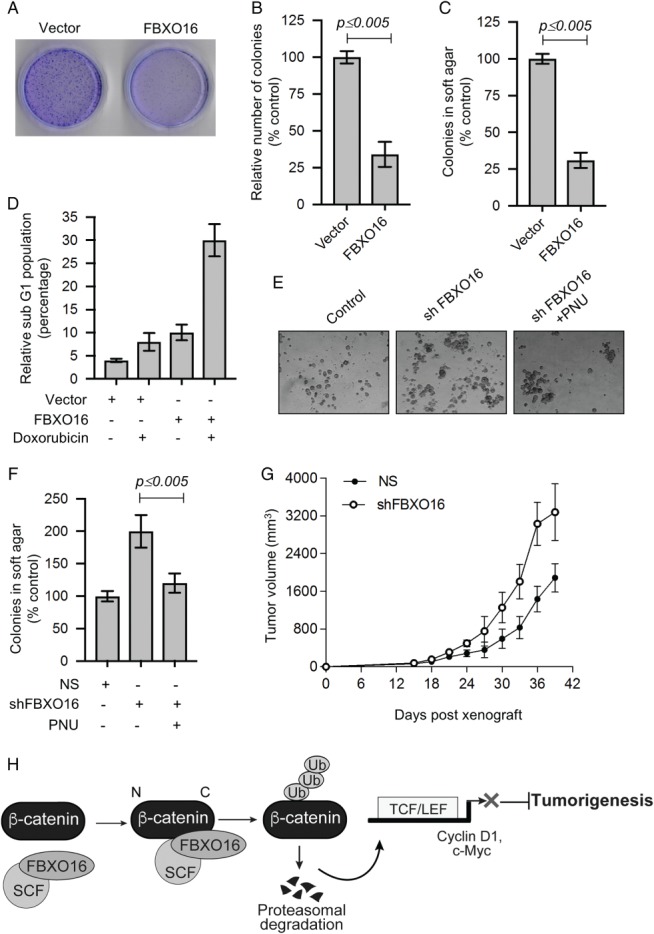
FBXO16 functions as putative tumor suppressor. (A) Long‐term colony formation of MDA‐MB‐231 cells expressing either vector control or DDK‐FBXO16. A total of 5000 transfected cells were seeded and allowed to grow for 15 days, and then, colonies were stained with crystal violet. The image represents one of the three biological replicates. (B) Number of colonies (from three independent experiments of panel A) were counted using ImageJ software and normalized to 100% for vector‐transfected cells. Data plotted as mean ± SD. (C) Soft agar colony formation assay of MDA‐MB‐231 cells expressing either vector control or DDK‐FBXO16. A total of 5000 transfected cells were seeded and allowed to grow for 21 days. Cells were then stained with crystal violet solution. Colonies were counted and normalized to 100% for vector control cells. Data are mean ± SD from three independent experiments. (D) Relative fraction of sub‐G0/G1 cell populations plotted with indicated treatments. (E) Soft agar colony formation assay of MCF7 cells expressing either NS or FBXO16 shRNA in the presence or absence of the β‐catenin inhibitor 500 nm PNU. A total of 5000 cells were used for this assay (n = 3). (F) Number of colonies of soft agar assay (as in panel E) was counted and normalized to 100% for NS cells. Data are mean ± SD (n = 3). (G) NOD‐SCID mouse xenograft growth of MCF7 cells expressing either NS or FBXO16 shRNA. Five mice were used for each group. (H) Model depicting the tumor‐suppressive activity of FBXO16 through the regulation of β‐catenin.
