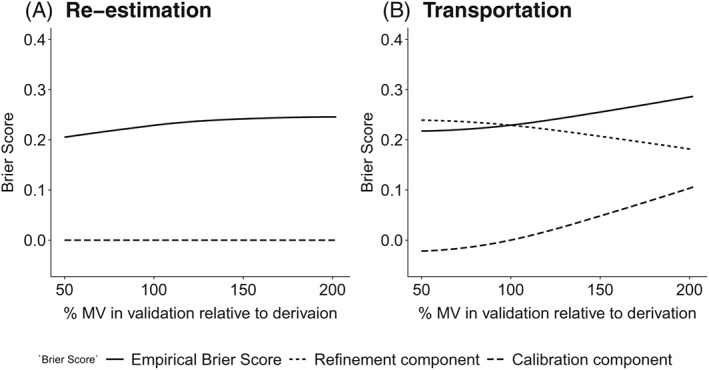
Figure 2.

Decomposed Brier score under predictor measurement error and predictor measurement heterogeneity. The data‐generating mechanism corresponded perfectly to the estimated logistic regression model. The plot displays the large sample properties of the components of the Brier score (Equation 7) under increasing random predictor measurement variance at validation, corresponding to the random measurement error model (Equation 2). The left panel shows the Brier score for a single‐predictor logistic regression model that is fitted using predictor measurement x and validated by re‐estimating the model on the same data using w. The right panel shows transportation from w at derivation to x at validation (up to %MV = 100) and transportation from x at derivation to w at validation (from %MV = 100 onwards). MV = measurement variance of the predictor measurement used for model validation relative to the predictor measurement used for derivation
