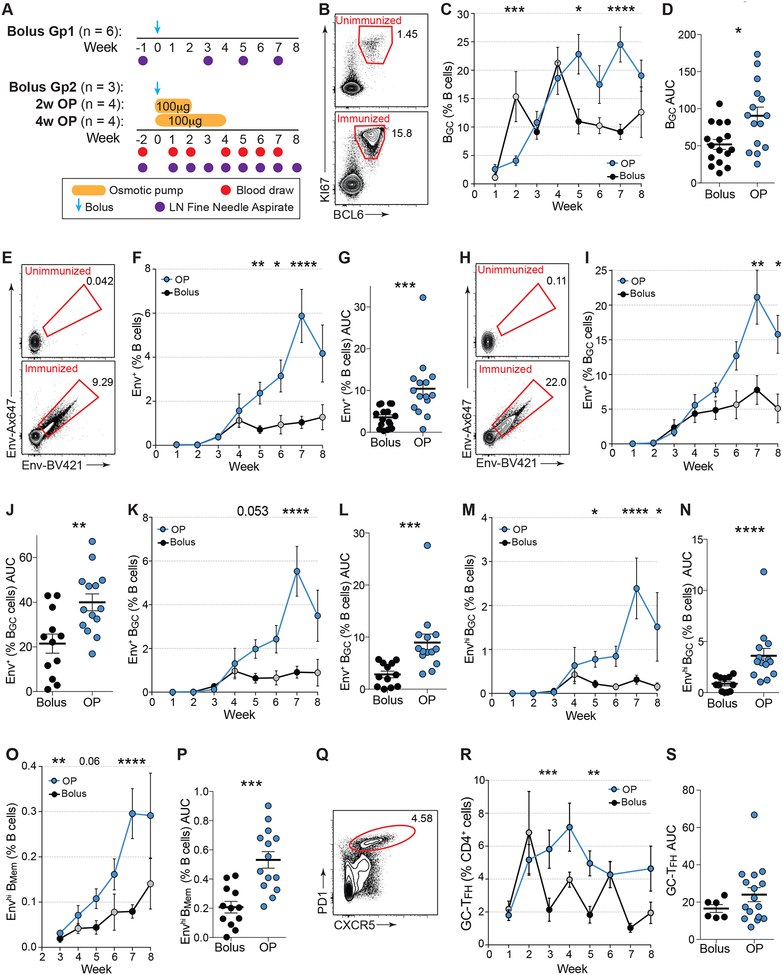
Figure 1. Sustained delivery immunization enhances BGC cell responses.
(A) Immunization and sampling schedule of first immunization. Bolus Group 2 (Gp2), 2w osmotic pump (OP), and 4w OP RMs were immunized and sampled at the same time. Bolus Gp1 were immunized and sampled separately. Bolus Gp1&2 data have been pooled.
(B) Representative BGC cell flow cytometry, gated on viable CD20+ B cells pre- and post-immunization. See Fig S1 for full gating strategy.
(C) BGC cell frequencies over time. Black circles, pooled bolus Gp1&2; grey circles, bolus Gp2.
(D) Cumulative BGC cell responses (AUC of C) to immunization within individual LNs at weeks 1, 3–7 [AUC].
(E) Representative flow cytometry of Env trimer-specific B cells pre- and post-immunization.
(F) Env-specific B cell frequencies over time.
(G) Cumulative Env trimer-specific B cells (AUC of F) within each LN.
(H) Representative flow cytometry Env trimer-specific BGC cells pre- and post-immunization.
(I) Env trimer-specific BGC cell frequencies over time.
(J) Cumulative Env trimer-specific BGC cells (AUC of I) within each LN.
(K) Env trimer-specific BGC cells over time.
(L) Cumulative Env trimer-specific BGC cells (AUC of K) within each LN.
(M) Frequencies of high-affinity Env trimer-specific BGC cells over time.
(N) Cumulative high-affinity Env trimer-specific BGC cells (AUC of M) within each LN.
(O) High-affinity Env trimer-specific BMem cells over time.
(P) Cumulative high-affinity Env trimer-specific BMem cell responses within individual LNs.
(Q) Representative flow cytometry of GC-TFH cells, gated on CD4+ T cells. See Fig S2 for full gating strategy.
(R) GC-TFH cells over time.
(S) Cumulative GC-TFH cell response between w1 plus w3-6 [AUC].
Mean ± SEM are graphed. Statistical significance tested using unpaired, two-tailed Mann-Whitney U tests. *p≤0.05, **p≤0.01. ***p≤0.001, ****p≤0.0001
See also Figures S1–2 and Data S1.

