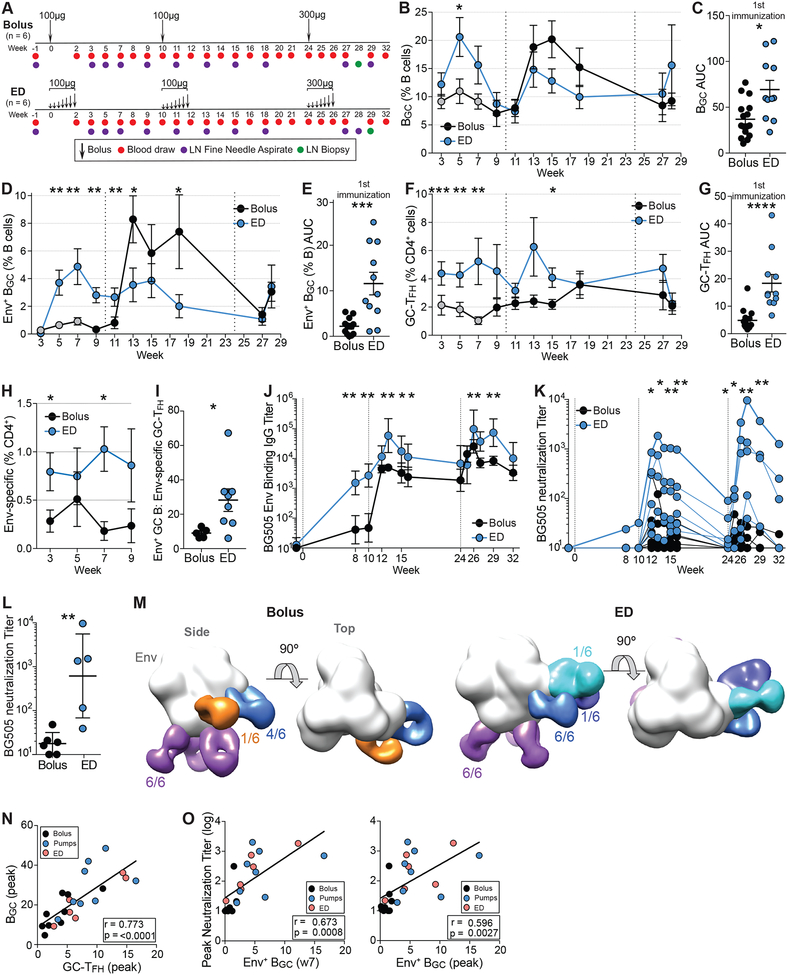
Figure 6. Dose escalating immunization strategy results in higher nAb titers.
(A) Immunization and sampling schedule. Groups were immunized and sampled contemporaneously.
(B) Total BGC frequencies over time. Data from bolus Gp2 (Fig 1) are included in these analyses (grey circles).
(C) Cumulative BGC cell response to the first immunization, calculated between w3-7 [AUC].
(D) Env trimer-specific BGC cells frequencies over time.
(E) Cumulative Env trimer-specific BGC cell responses to one immunization.
(F) Total GC-TFH cell frequencies over time.
(G) Cumulative GC-TFH responses to one immunization (AUC of F).
(H) Env-specific CD4+ responses after one immunization.
(I) Ratio of Env+ BGC to Env-specific GC-TFH cells at w5, calculated as Env+ BGC (% B cells)/ Env-specific GC-TFH (% CD4+).
(J) BG505 Env trimer binding IgG titers over time.
(K) Autologous BG505 nAb titers over time.
(L) Peak BG505 nAb titers after three immunizations.
(M) Composite 3D reconstruction of Env trimer bound to Fabs isolated from all animals after two immunizations. 3D EM reconstructions from individual animals can be seen in Figure S8A.
(N) Correlation between peak GC-TFH and BGC cell % during 1st immunization from both studies.
(O) Correlation between Env+ BGC cells (% B cells) and peak neutralization titers. Env+ BGC cell values are from w7 or peak frequencies during 1st immunization. Peak nAb titers are after 2nd immunization.
Serological data represent GMT ± geometric SD. Cell-frequency data represent mean ± SEM. Statistical significance was tested using unpaired, two-tailed Mann-Whitney U tests. *p<0.05, **p<0.01, ***p<0.001, ****p<0.0001. See also Figure S7–8 and Data S2.

