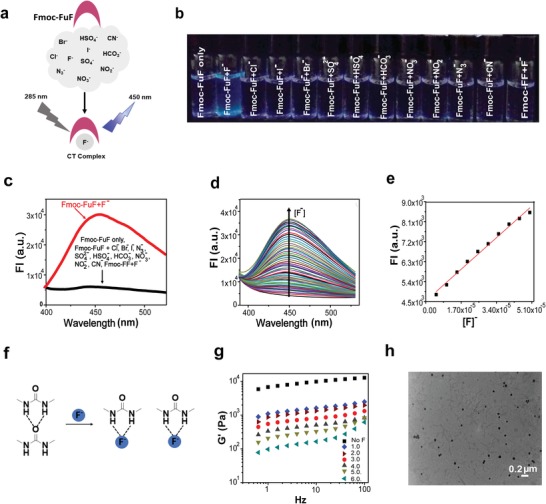
Figure 3.

Selective anion binding by Fmoc‐FuF. a) Schematic representation of selective binding of F− by Fmoc‐FuF, forming a charge‐transfer complex. b) Photograph of Fmoc‐FuF (5 × 10⁻⁶ m) DMSO solutions after the addition of 500 equiv. of various aqueous anion solutions under UV illumination (λex = 365 nm). c) Fluorescence emission spectra of Fmoc‐FuF (5 × 10⁻⁶ m) DMSO solutions upon the addition of 450 equiv. of various aqueous anion solutions (λex = 285 nm). d) Fluorescence intensity (FI) of Fmoc‐FuF (5 × 10⁻⁶ m) in DMSO solutions upon titration with 0–1000 equiv. of aqueous F− solution (λex = 285 nm). e) Plot of log[FI] versus F− concentration. Red line is a linear fit, R 2 = 0.99. f) Schematic illustration of breakage of Fmoc‐FuF hydogel by F−. Dashed lines represent hydrogen bonds. g) Frequency sweep measurement of Fmoc‐FuF hydrogels (0.5 wt%) containing increasing F− concentration (0–6.0 equiv. of F−). h) TEM image of Fmoc‐FuF gel (0.5 wt%) containing 6.0 equiv. of F−.
