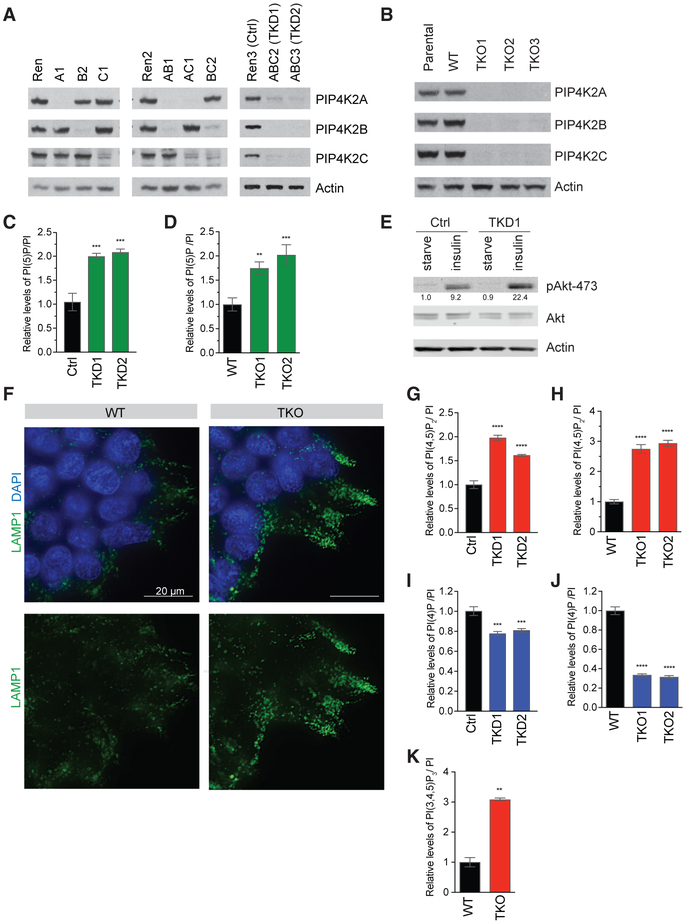
Figure 1. Validation of Tools to Eliminate All Three PIP4K Isoforms Reveals Paradoxical Increase in PI(4,5)P2.
(A) Western blots showing the efficiency of knockdown of PIP4K isoforms in HeLa cells. Cell line notation and their descriptions are listed in Table S2.
(B) Western blots showing 293T clones with CRISPR-mediated knockout of PIP4K2A, PIP4K2B, and PIP4K2C, with cell line descriptions in Table S2. Parental cell line is in the first lane, and the CRISPR clonal cell line with intact PIP4K is designed as WT. A faint non-specific band that runs slightly faster than PIP4Ks is just visible.
(C and D) Quantification by HPLC of PI(5)P, which increases in cells with the loss of PIP4K, shown in HeLa TKD cells (C) as well as 293T TKO cells (D).
(E) Knock down of PIP4K enhances insulin signaling in HeLa cells, as shown by western blot. Quantification by Li-Cor indicated the respective bands below.
(F) Immunofluorescence detection of lysosomal marker Lamp1 showing increased lysosomal accumulation in 293T TKO versus control cells. Representative images shown.
(G and H) PI(4,5)P2 increases in cells with loss of PIP4K, shown in HeLa TKD cells (G) and 293T TKO cells (H), measured by HPLC.
(I and J) PI(4)P decreases in cells with loss of PIP4K, shown in HeLa TKD cells (I) and 293T TKO cells (J), measured by HPLC.
(K) 293T TKO cells have higher levels of PI(3,4,5)P3, as measured by HPLC.
Significance calculated using ANOVA with Holm-Sidak multiple comparisons to control cell line with intact PIP4K. **p < 0.01, ***p < 0.001, and ****p < 0.0001. Data are represented as means ± SEMs. n = 3.

