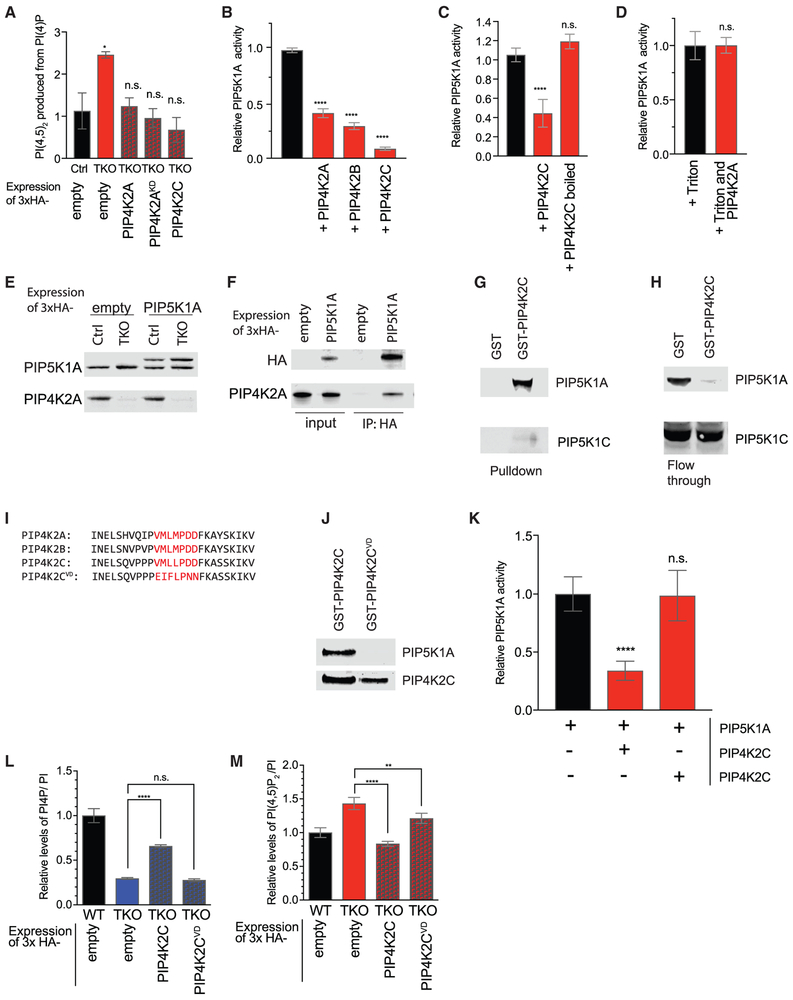
Figure 3. PIP4K Inhibits PIP5K Activity.
(A) Changes in PIP5K activity in 293T cells. Cell pellets were normalized to cell number and sonicated in the presence of excess PI(4)P. Radioactive ATP32 was added for kinase reaction. Lipids were extracted and quantified by TLC, with confirmation by HPLC after deacylation.
(B–D) Quantification of in vitro kinase assay measuring conversion of PI(4)P to radiolabeled PI(4,5)P2 by PIP5K1A. PIP5K1A activity is inhibited in vitro by addition of 2- to 10-fold molar excess of PIP4K2A, PIP4K2B, or PIP4K2C (B). Once denatured, PIP4K2C no longer inhibits PIP5K1A (C). In the presence of 0.1% Triton X-100, PIP4K2A no longer inhibits PIP5K1A activity (D).
(E) Western blot validation of near-endogenous level expression of 3xHA-PIP5K1A levels in 293T control and TKO cells. Tagged 3xHA-PIP5K1A is slightly larger than the endogenous protein.
(F) Pull-down using anti-HA beads from 293T WT cells expressing empty 3xHA vector (empty) or 3xHA-PIP5K1A (PIP5K1A). Western blot of input (first two lanes) and immunoprecipitation of endogenous PIP4K2A with PIP5K1A (second two lanes).
(G and H) 293T lysates were incubated with beads pre-incubated with either GST or GST-PIP4K2C, used as bait. Pull-downs analyzed by western blot strongly to detect the enrichment of PIP5K1A and PIP5K1C(G). Analysis of flow-through reflects the extent to which lysate is depleted of PIP5K1A and PIP5K1C by bait (H).
(I) Sequence homology of N-terminal region in PIP4K. Mutated residues of PIP4K2C aa69–75 are indicated in red.
(J) 293T lysates were incubated with beads conjugated to GST-PIP4K2C or GST-PIP4K2CVD, used as bait. Bead pull-downs were analyzed by western blot for the presence of PIP5K1A, which is able to bind WT PIP4K2C but not PIP4K2CVD.
(K) Quantification of in vitro kinase assay measuring the conversion of PI(4)P to radiolabeled PI(4,5)P2 by PIP5K1A, which is inhibited by PIP4K2C but not PIP4K2CVD.
(L and M) Quantification by HPLC of PI(4)P (L) and PI(4,5)P2 (M) in HEK293T TKO cell lines rescued with PIP4K2C and PIP4K2CVD.
Significance calculated using ANOVA with Holm-Sidak multiple comparisons to control cell line. **p < 0.01, ****p < 0.0001, and n.s., not significant. Data are represented as means ± SEMs. n = 3.

