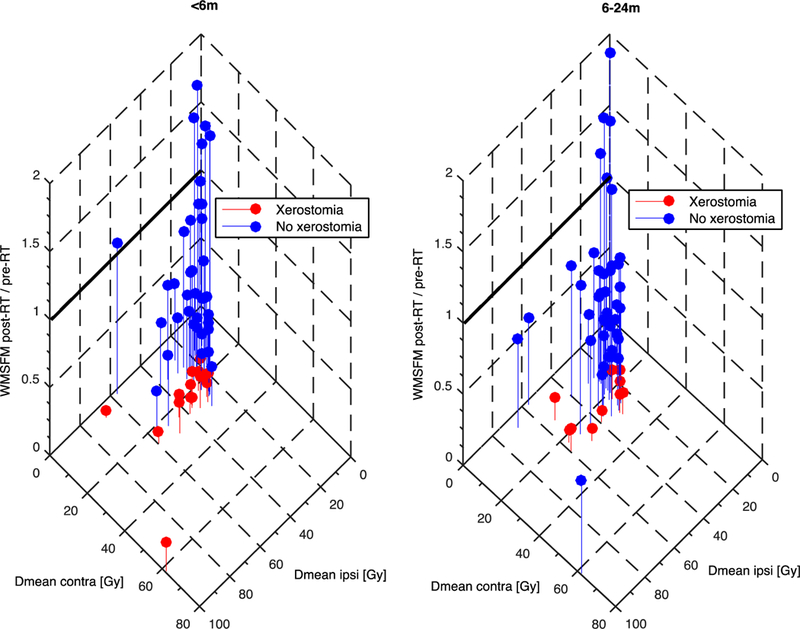
Figure 2.

A three-dimensional scatter plot illsutrating the relationship between the ratio of WMSFM pre- and post-RT (z-axis), Dmeancontra (y-axis), and Dmeanipsi (x-axis) for patients experiencing (red), and not experiencing (blue) xerostomia for a <6 months follow-up (left), and a 6 – 24 months follow-up (right).
Note: Patients fulfilling the one-gland QUANTEC guideline are located left of the dashed 20 Gy y-axis line, and patients with a WMSFM post-RT/pre-RT ˃1.0 are located above the solid z-axis line.
