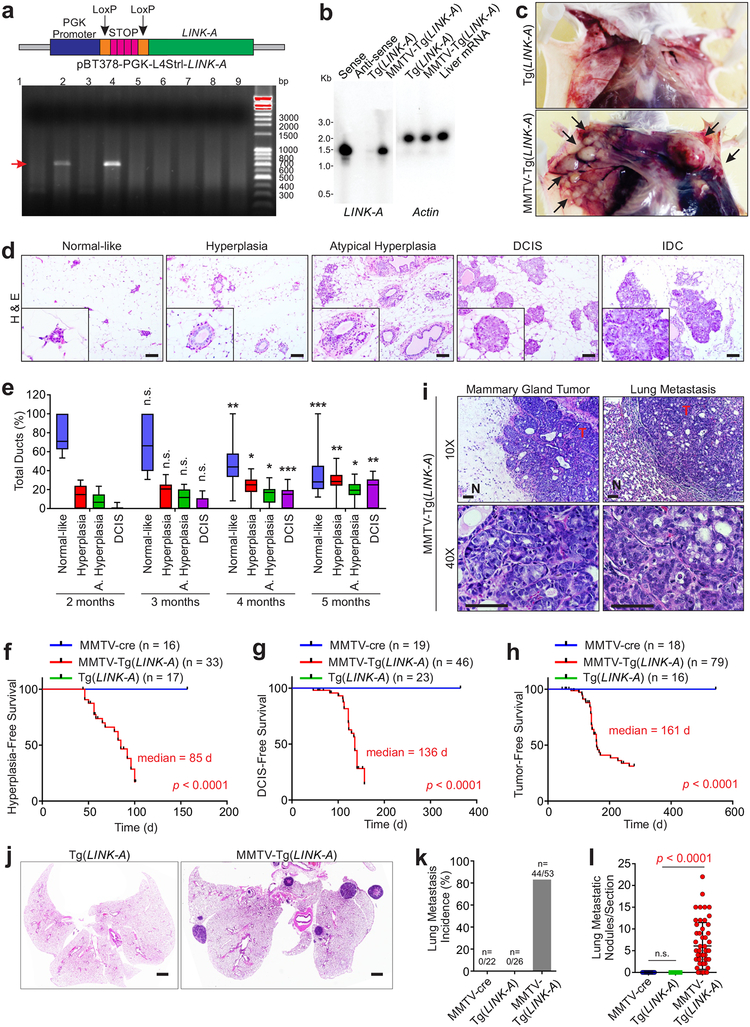
Figure 2: LINK-A initiates mammary gland tumors that models human TNBC.
a, Top panel: graphic illustration of tissue-specific expression of human LINK-A gene. Bottom panel: DNA agarose gel indication of Tg(LINK-A) genotyping. Three independent experiments were performed and yielded similar results. b, Northern blot detection of LINK-A or Actin using in vitro transcribed LINK-A sense, antisense or total RNA extracted from Tg(LINK-A) or MMTV-Tg(LINK-A) mammary gland. Three independent experiments were performed and yielded similar results. c, Representative images of Tg(LINK-A) or tumor-bearing MMTV-Tg(LINK-A) mice. Blue arrows: mammary gland tumors. Three independent experiments were performed and yielded similar results. d and e, H&E staining (d) or statistical analysis (e) of MMTV-Tg(LINK-A) mammary gland of animals at 2, 3, 4, or 5 month of age to indicate the development from normal-like breast epithelial cells through hyperplasia, atypical hyperplasia, DCIS and IDCs. Scale bar: 100 μm (d). Error bars (e): S.E.M. n=9, 15, 15, 11 animals respectively, unpaired Student’s t-test. f-h, Kaplan-Meier survival analysis of MMTV-cre, MMTV-Tg(LINK-A) or Tg(LINK-A) mice according to the presence of hyperplasia (f), DCIS (g) or IDC (h). n=16, 33, 17 (f) 19, 46, 23 (g) or 18, 79, 16 (h) animals respectively (log rank test). i, Representative images of MMTV-Tg(LINK-A) primary tumor and lung metastasis. T: tumor; N: adjacent normal tissue. Three independent experiments were performed and yielded similar results. Scale bar: 100 μm. j-l, Representative images of Tg(LINK-A) or MMTV-Tg(LINK-A) lung (j). Three independent experiments were performed and yielded similar results. Lung metastasis incidence of tumor-bearing mice (k) or metastatic nodules/section (l) of MMTV-cre, Tg(LINK-A) or MMTV-Tg(LINK-A) lung (n=18, 16, 53). Results are mean ± s.d.. P values were determined by unpaired two-tailed Student’s t test. Scale bar: 1mm (j).

