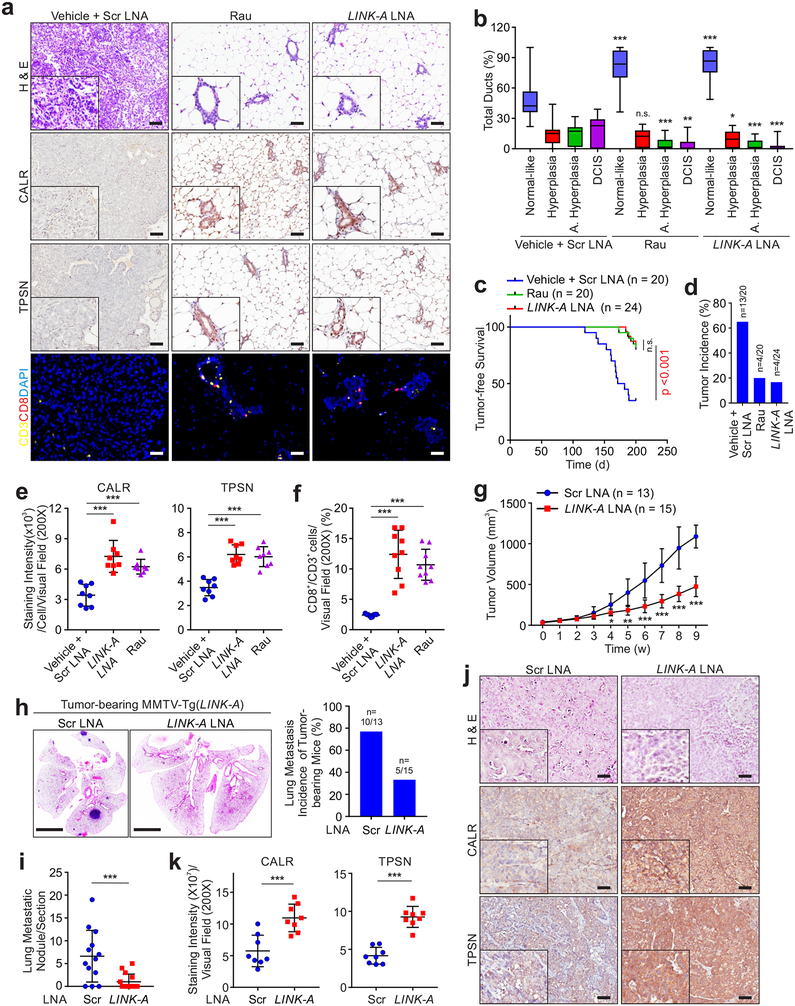
Figure 7: Targeting LINK-A prevents mammary gland tumor initiation and progression.
a, H&E staining, immunohistochemistry staining of CALR, TPSN and fluorescent multiplex immuno-histochemistry labeling of CD3 and CD8 in MMTV-Tg(LINK-A) mammary gland treated with indicated treatments. Six random fields per animal and twenty animals or twenty-four per experimental condition were analyzed. Scale bar: 50 μm. b, Percentage of normal-like, hyperplasic, atypical hyperplasic ducts and DCIS of MMTV-Tg(LINK-A) mammary gland with indicated treatments (n.s., p>0.05, *p<0.05, **p<0.01, ***p<0.001). Results are mean ± s.d. of n=20, 20, 24 animals. P values were determined by unpaired two-tailed Student’s t test. c and d, Kaplan-Meier survival analysis and tumor incidence of MMTV-Tg(LINK-A) mice with indicated treatments (n=20, 20, 24 animals) (n.s., p>0.05, ***p<0.001). e and f, Statistical analysis of staining intensities of CALR (e, left panel), TPSN (e, right panel), or percentage of CD8+ cells of CD3+ cells per visual field (f) of MMTV-Tg(LINK-A) mammary gland with indicated treatments. n=8, 8, 8 (e) or 8, 9, 9 (f) animals (***p<0.001). Results are mean ± s.d., P values were determined by one-way ANOVA. g, Tumor volume of MMTV-Tg(LINK-A) mice treated with scramble or LINK-A LNAs (n=13, 15 animals) (*p<0.05, **p<0.01, ***p<0.001). Results are mean ± s.d.. P values were determined by unpaired two-tailed Student’s t test. h and i, Representative images of lung (h, left), lung metastasis incidence of tumor-bearing mice (h, right) or metastatic nodules/section (i) of MMTV-Tg(LINK-A) tumor-bearing mice treated with scramble or LINK-A LNAs (n=13, 15 animals). Scale bar (h): 4mm. Error bar (i), (***p<0.001). Results are mean ± s.d.. P values were determined by unpaired two-tailed Student’s t test. j and k, Representative images (j) and statistical analysis (k) of CALR (k, left), and TPSN (k, right) staining intensities of MMTV-Tg(LINK-A) mice treated with scramble or LINK-A LNAs (n=8, 8 animals). (j) Scale bar: 100 μm. (k) (***p<0.001). Results are mean ± s.d.. P values were determined by unpaired two-tailed Student’s t test.

