Figure 1.
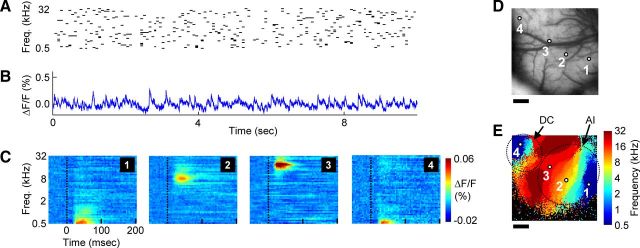
Ongoing activity recorded during continuous acoustic stimulation reveals acoustic frequency tuning across auditory cortex core areas. A, Schematic of sound stimulus, composed of pseudo-randomly occurring pure-tone pips with frequencies ranging from 500 Hz to 32 kHz. B, Ongoing fluorescence signal measured during acoustic stimulation from a small region (2 × 2 pixels, centered on region “1”) of AI. C, Acoustic frequency-receptive fields from example (2 × 2 pixel) regions of core auditory cortex areas AI and DC, showing the averaged temporal response to each of the 49 different frequencies. D, Image of cortical vasculature within the 5 × 5 mm imaging area, with the four example region locations indicated. E, Each pixel is color-coded according to which of the 49 frequencies elicited the maximal response, yielding a tonotopic map of auditory cortex fields AI and DC. Nonresponsive pixels are colored black. Dotted lines show approximate borders of AI and DC for illustrative purposes only. Scale bars: D, E, 1 mm.

