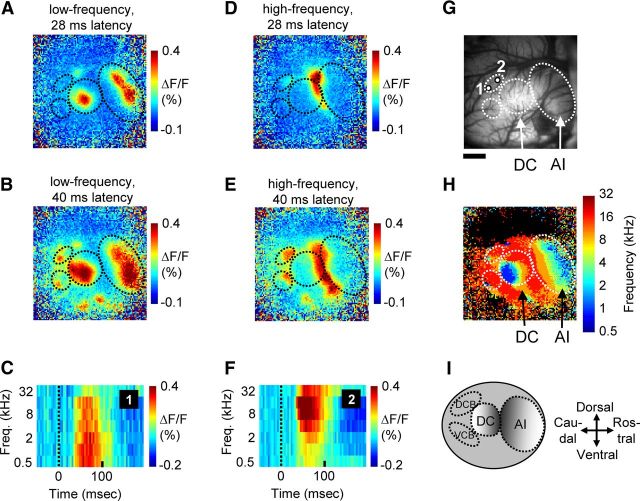
Figure 2.
Cortical activation pattern in response to sparsely presented stimuli reveals organization of core and belt auditory cortical areas. A, B, Cortical activation pattern following stimulation with a low-frequency (0.5 kHz) tone. At a latency of 28 ms (A), core areas AI and DC are activated. At a longer latency of 40 ms (B), belt regions are also recruited. C, Acoustic frequency-receptive field from the example (2 × 2 pixel) region of the DCB area (region “1” indicated in G), showing the averaged temporal response to each of the seven sparsely presented pure tones. D, E, Activation pattern following high-frequency (32 kHz) tone stimulation at a latency of 28 (D) or 40 ms (E). F, Acoustic receptive field from the example region of the DCB area (region “2” indicated in G), showing the averaged temporal response to pure tones of seven different frequencies. G, Image of vasculature for the 10 × 10 mm imaging area, with the two example region locations of DCB indicated. H, The tonotopic map derived by color coding each pixel according to the frequency eliciting the maximal response. I, Schematic illustration of guinea pig auditory cortex, showing the two core fields AI and DC and the two surrounding belt fields that were the focus of this study. Scale bar: G (for A, B, D, E, H), 2 mm.

