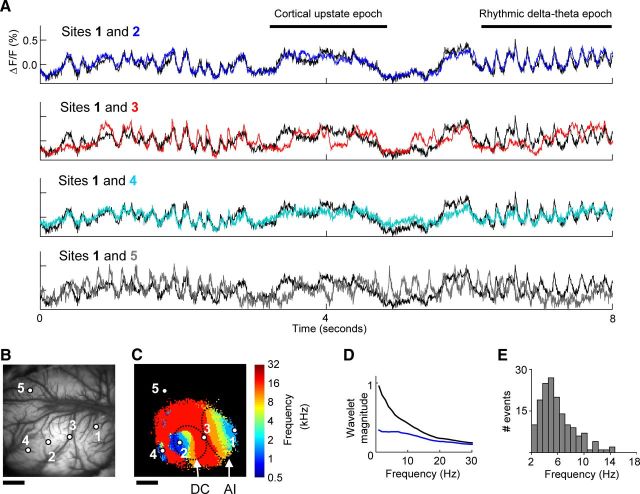
Figure 3.
Ongoing slow-wave spontaneous activity recorded across functionally defined regions of several auditory cortical fields. A, Ongoing activity measured during silence across auditory and nonauditory cortex. Black trace, in all four plots, is from the low-frequency region of core area AI (2 × 2 pixels, centered on region “1” in B and C). Blue trace (region “2”) is from low-frequency region of core area DC. Red trace (region “3”) is from the high-frequency region at the border of areas AI and DC. Cyan trace (region “4”) is from a low-frequency region of belt area VCB. Gray trace (region “5”) is from a region not responsive to the acoustic stimulus. B, Image of cortical vasculature within the 10 × 10 mm imaging region, with the five example region locations indicated. C, The tonotopic map measured from this imaging region. D, Wavelet amplitude spectra calculated from ongoing activity during silence (black) or during acoustic stimulation (blue, stimulus as in Fig. 1A), averaged over all auditory cortex core tonotopic bins from all animals. The wavelet analysis was performed as described in the Materials and Methods, but at wavelet frequencies ranging from 1 to 30 Hz. E, Histogram of interevent intervals for rhythmic event epochs from all animals, revealing a peak in the delta-theta range. Scale bars: B, C, 2 mm.

