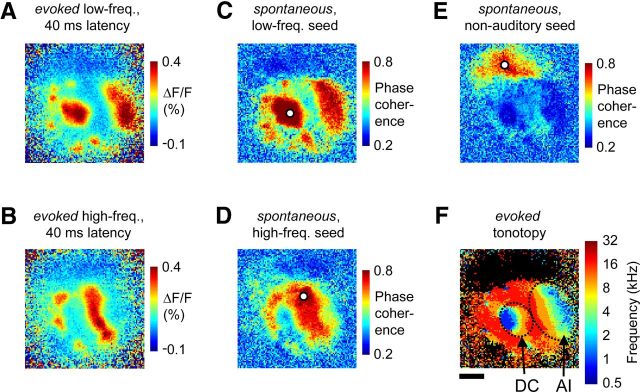
Figure 4.
Ongoing activity phase coherence is highest between tonotopically matched subregions of core and belt auditory cortex. A, Evoked cortical activation pattern following stimulation with a low-frequency (0.5 kHz) tone at a latency of 40 ms, when both core and belt areas are recruited. B, Activation pattern following stimulation with a high-frequency (32 kHz) tone at a latency of 40 ms. C–E, Example maps of spontaneous activity phase coherence. A wavelet phase-coherence analysis (with a 4 Hz Morlet wavelet) was performed across a 30 s epoch of ongoing activity during silence, between the single “seed” pixel highlighted in white in each panel and all other map pixels. The seed pixel was located in low-frequency core cortex (C), high-frequency core cortex (D), or a nearby nonauditory region (E). Note that phase coherence during spontaneous activity was highest between several noncontiguous regions having similar best-frequency preference. F, The evoked tonotopic map from this case (same as in Fig. 2). Scale bar: F (for A–F), 2 mm.

