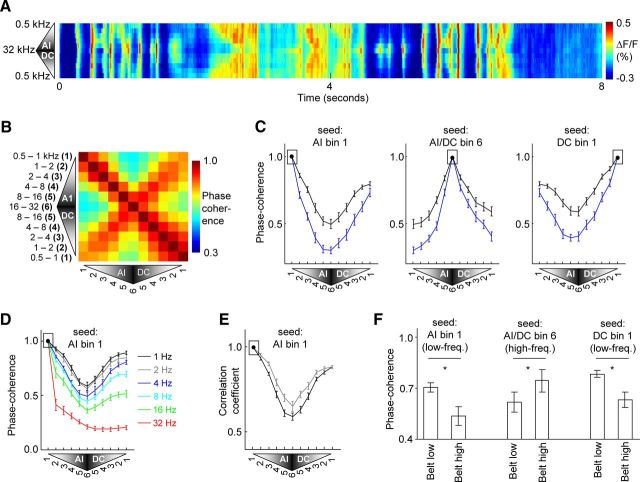
Figure 5.
Ongoing activity phase-coherence quantification across core and belt auditory cortex. A, Pixels in core auditory cortex areas AI and DC were grouped according to their sound-frequency preference into one of six one-octave-sized bins. These bins were ordered along the vertical dimension of the image to preserve the tonotopic order across AI and DC. The mean spontaneous activity over all pixels of each bin is plotted over time. B, Pixels in AI or DC were grouped into one-octave sized bins as in A. The order of the bins in each axis of the plot corresponds to the topographic representation order across AI and DC. The phase-coherence value during ongoing spontaneous activity (with a 4 Hz wavelet) between pixels of each pair of bins is indicated and represents the mean over all animals. C, Plots of the phase coherence between a given tonotopic seed bin of area AI (indicated by black box) and all other bins of areas AI and DC. Calculations are for ongoing activity either during silence (black trace) or during continuous acoustic stimulation (stimulus as in Fig. 1A, blue trace). The mean and SEM across animals are shown. D, Phase coherence of ongoing activity during silence between tonotopic bin 1 of AI and other bins, where the wavelet frequency was 1, 2, 4, 8, 16, or 32 Hz as indicated by the line color. E, The linear correlation coefficient during ongoing activity between the low-frequency bin of area AI (indicated by black box) and all other tonotopic bins of AI and DC. Calculations represent the mean and SEM over all epochs of ongoing activity containing only either rhythmic delta-theta events (N = 56; gray trace) or cortical upstates (N = 132; black trace). F, Phase coherence during spontaneous activity between the tonotopic bin of core auditory cortex indicated, and either the low- or high-frequency region of the belt. The mean and SEM across animals are shown.

