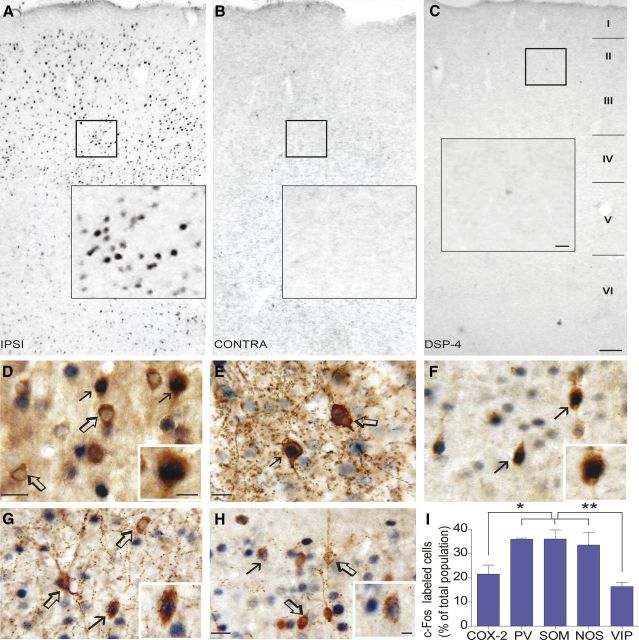
Figure 2.
Identification of the recruited cortical neuronal network by LC stimulation. A–C, Photomicrographs of immunostained sections for c-Fos in the frontoparietal cortex induced by LC stimulation in controls or DSP-4 treated rats. D–H, Photomicrographs of double-immunostained sections for c-Fos (SG, blue–gray nuclei) and different neuronal markers (DAB, brown): COX-2 pyramidal cells (D) and GABA interneurons expressing PV (E), SOM (F), NOS (G), or VIP (H). Filled arrows show activated cells, whereas open arrows indicate absence of c-Fos expression. I, Quantitative analysis of double-labeled c-Fos COX-2 pyramidal cells or GABA interneuron subtypes in layers II–IV of the ipsilateral frontoparietal cortex. *p < 0.05, **p < 0.01, one-way ANOVA and a Newman–Keuls post hoc test. Scale bars: A–C, 100 μm; insets, 20 μm; D–G, 20 μm; insets, 10 μm.

